The LinkedOmicsKB web portal assembles precomputed analysis results into ~40,000 gene-, protein-, mutation-, and phenotype-centric web pages. Here we describe the primary organization and functionalities of these web pages.
Gene page
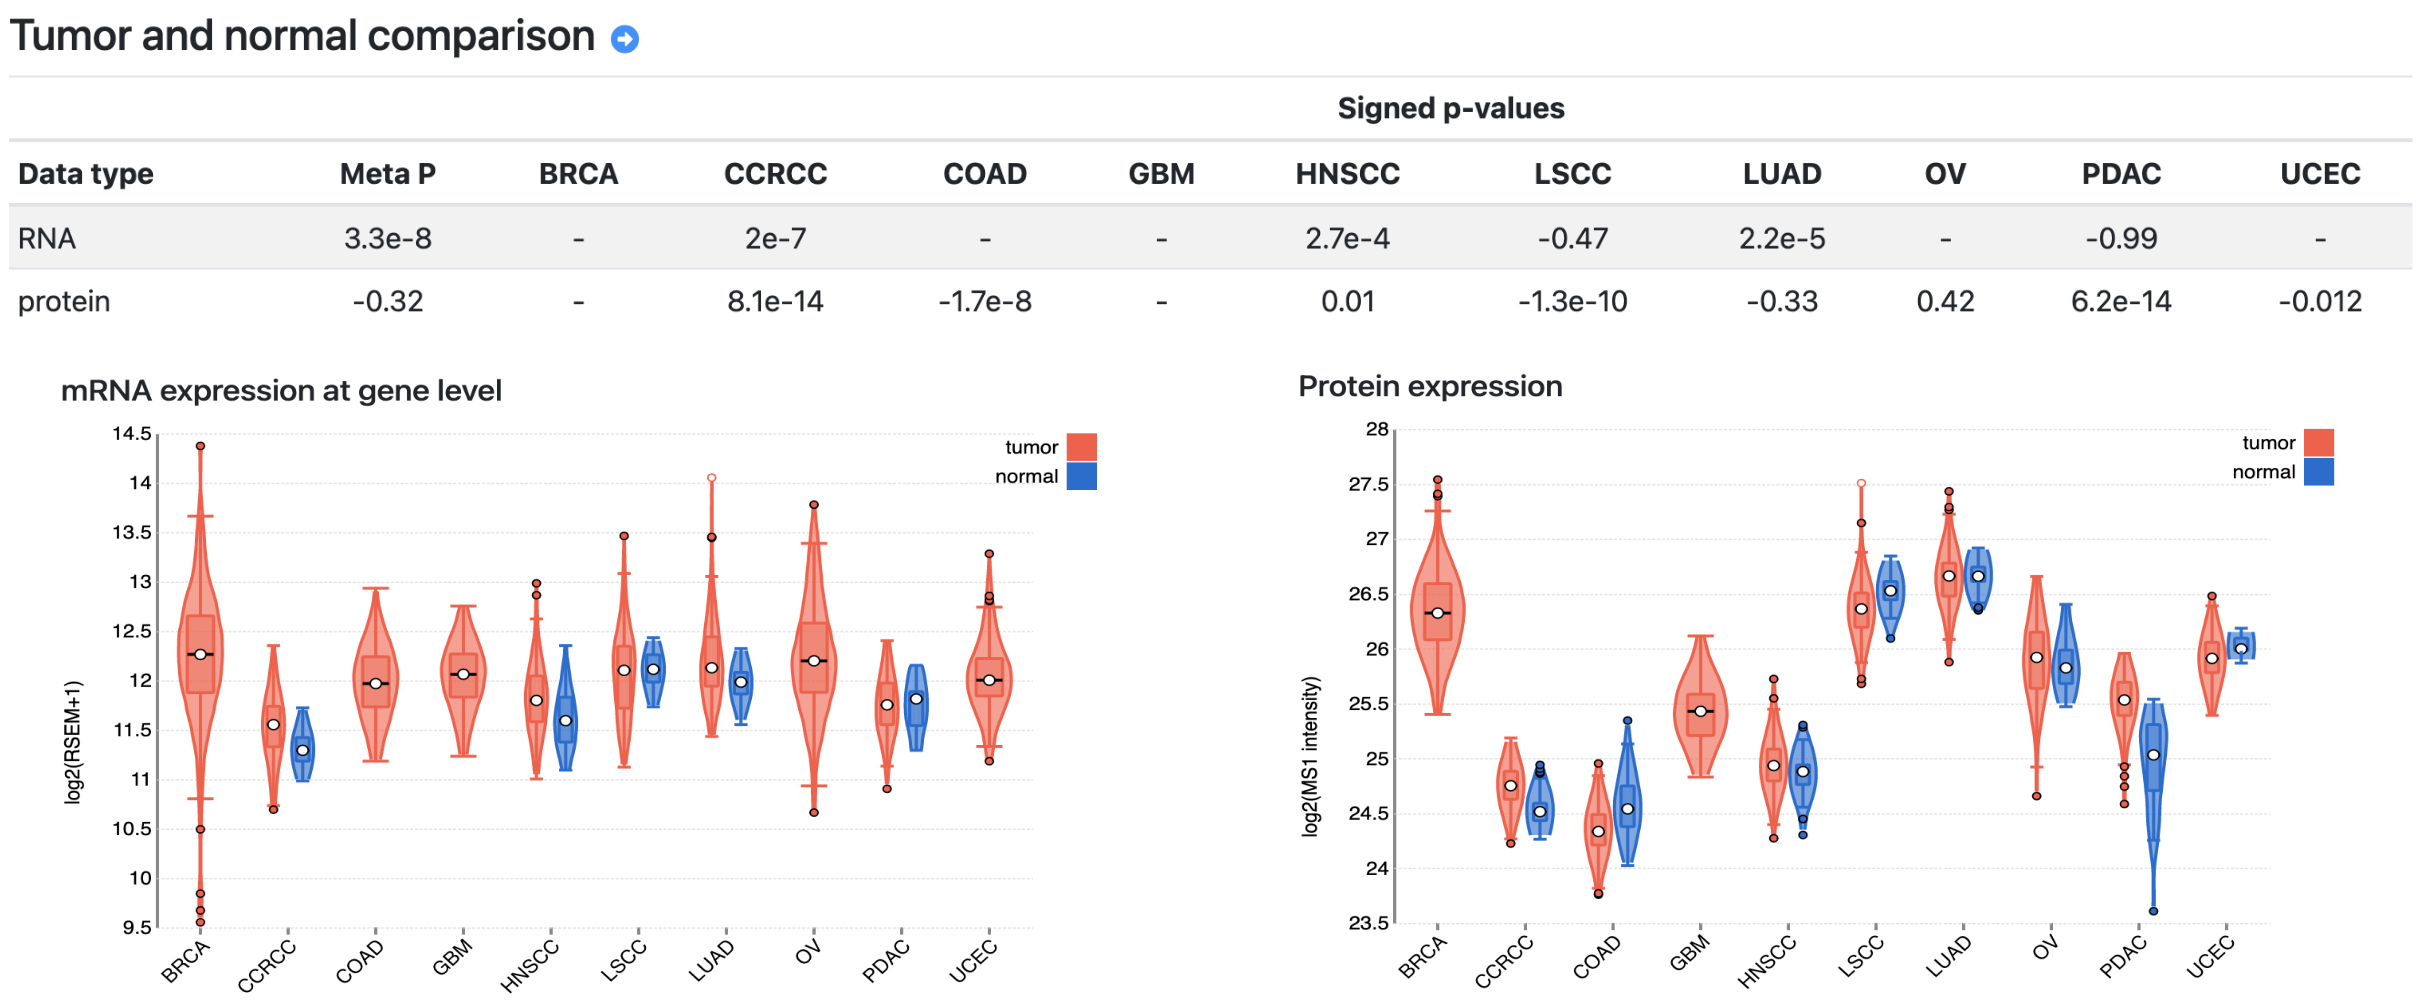
A gene page includes six sections. The basic information section shows the gene description from the RefSeq database and functional annotations compiled from multiple sources, such as cancer driver, kinase, and drug target annotations. The protein product section lists all protein products of the gene, with links to protein pages (see below) of systematically selected primary and secondary proteins. The tumor vs normal comparison section presents differential analysis results at mRNA and protein levels, respectively (Fig. 1).
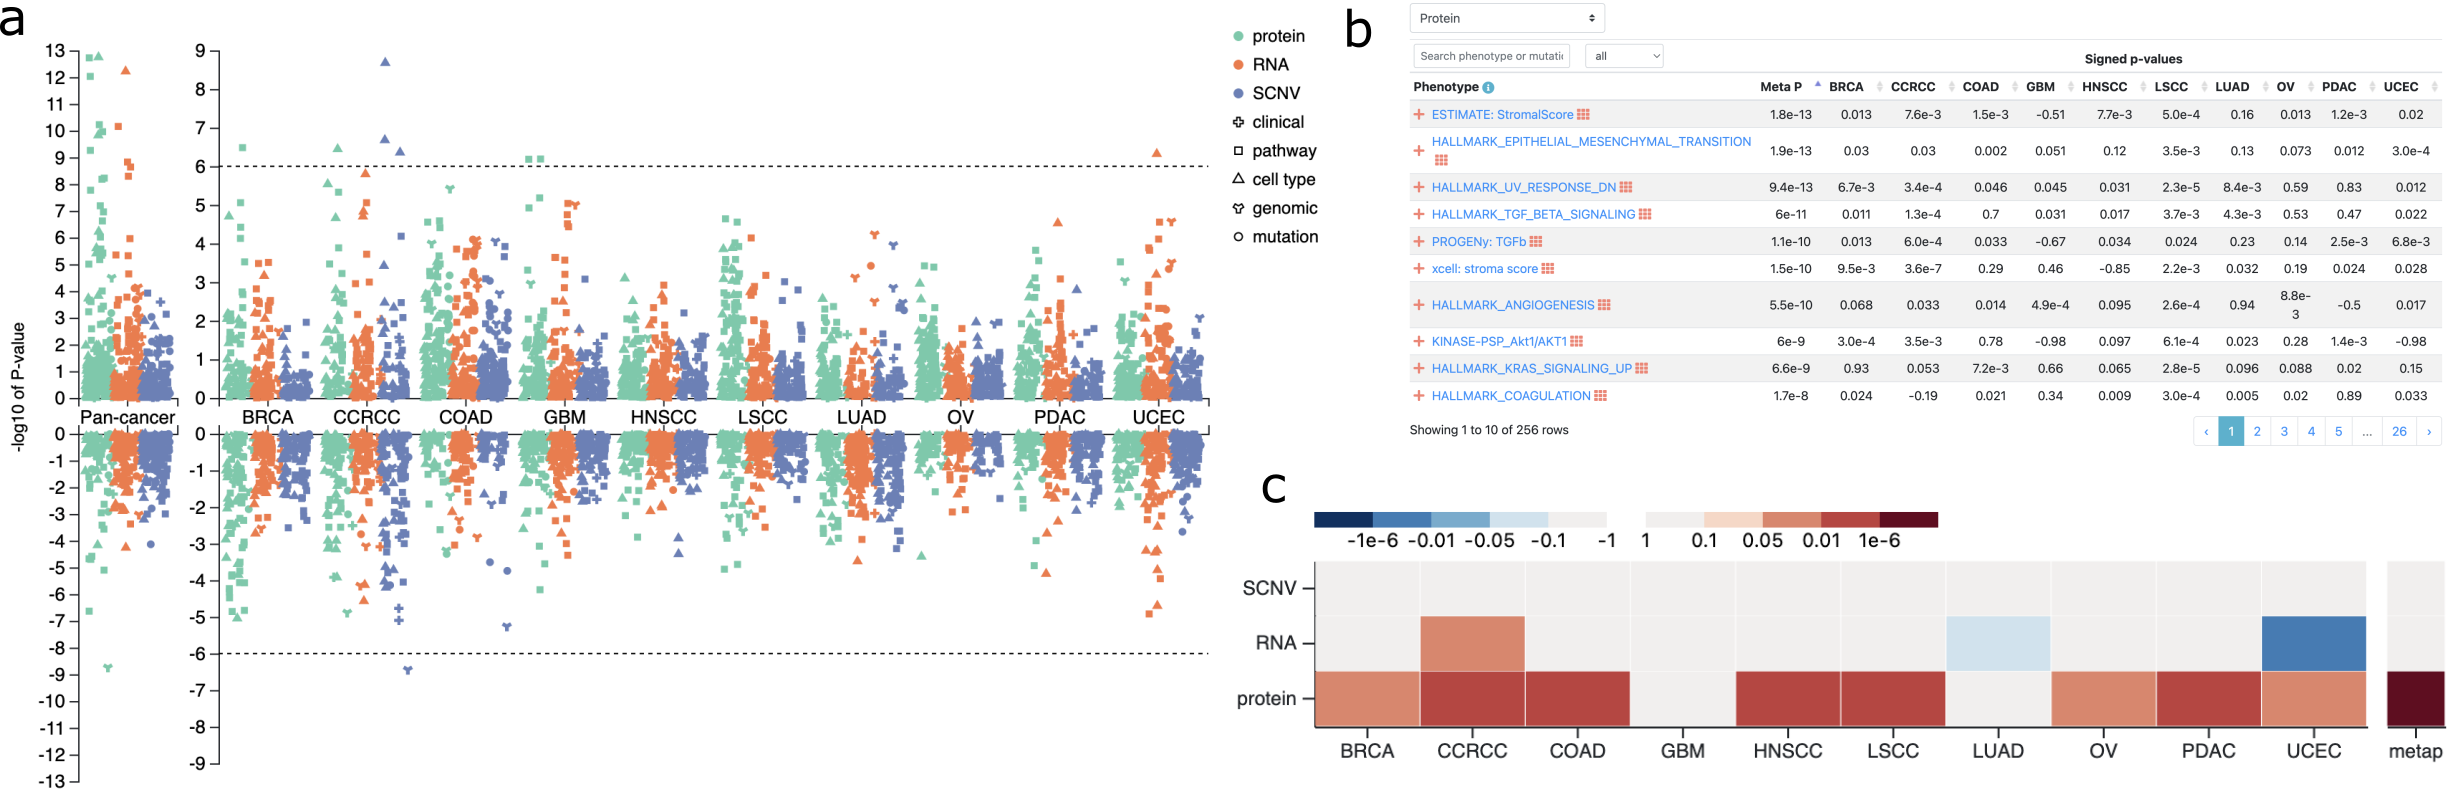
The phenotype and mutation association section begins with a Manhattan plot summarizing associations between the gene and all clinical phenotypes, molecular phenotypes, and somatic mutations across all cancer types at copy number, mRNA, and protein levels, respectively (Fig. 2a). This plot enables quick identification of cancer types and omics data types with interesting associations, as well as interactive examination of the top, highly significant associations. Detailed association results are presented in a sortable, searchable, filterable, and expandable table that can be switched between protein, mRNA, and copy number views (Fig. 2b). The table was designed to hold four dimensions (4D) of information, with columns corresponding to individual cancer types or pan-cancer, primary rows corresponding to associations between a phenotype/mutation and the omics data type of the primary view, expandable rows displaying associations at other omics levels for multi-omics comparison, and pop-up windows with appropriate statistical plots supporting the signed p-values displayed in the table, such as scatter plot, box plot or Kaplan-Meier plot. Phenotypes and mutations in the table are linked to corresponding phenotype and mutation pages (see below), and a heatmap summarizing pan-cancer, multi-omics association results is also available for each phenotype or mutation (Fig. 2c).
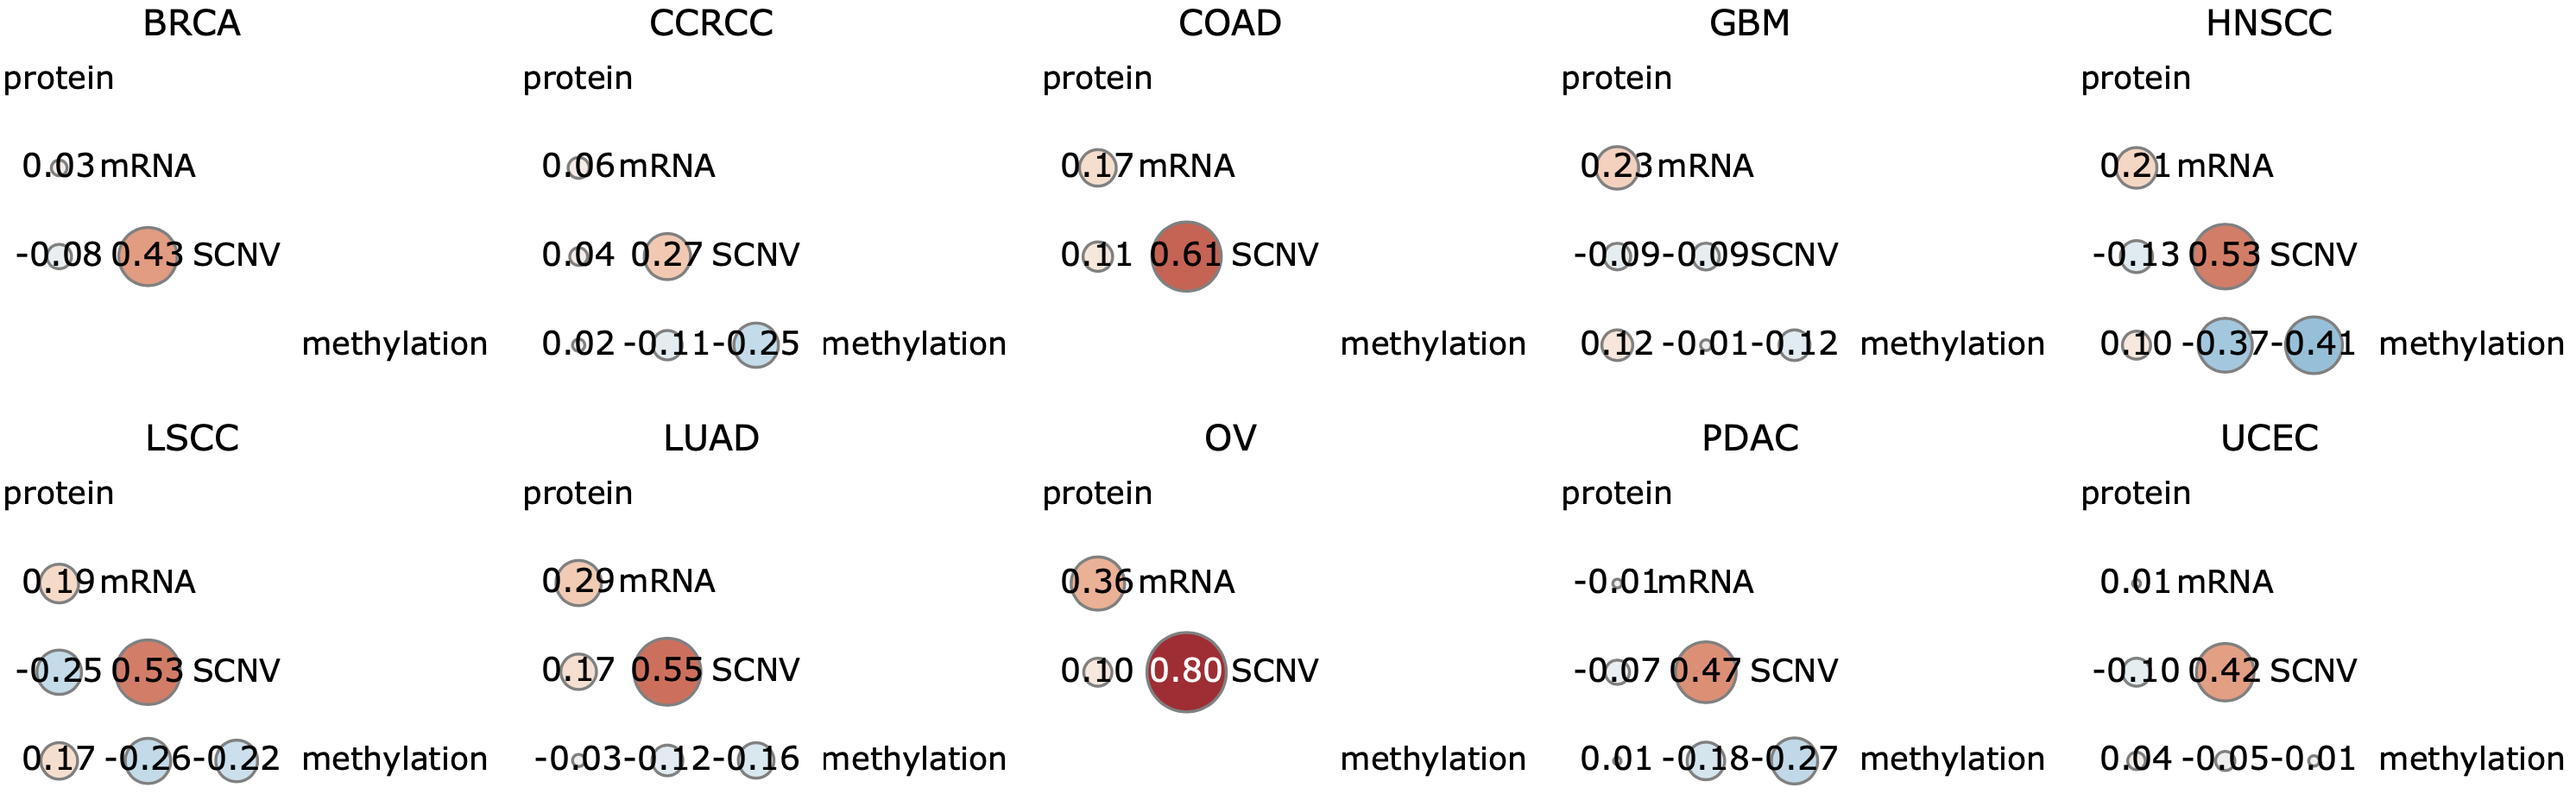
The cis-association section depicts pairwise associations between protein, mRNA, copy number, and methylation levels of the gene within each cancer type in a correlogram (Fig. 3), in which each circle can be clicked to show the corresponding scatter plot. The cis-association between different omics measurements could hint at interesting regulatory mechanisms. The trans-association section displays association results between the gene and all other protein coding genes at mRNA and protein levels, respectively, in a 4-D table similar to the phenotype association table. In addition to providing an easy way to navigate through the top associated genes, the complete trans-association results for individual data types in a selected cancer type or the pan-cancer results can be forwarded to WebGestalt with a single click for pathway and gene set enrichment analysis. This provides a means for gene function inference based on the guilt-by-association hypothesis, which is particularly compelling when applied to protein association data.
Protein isoform page
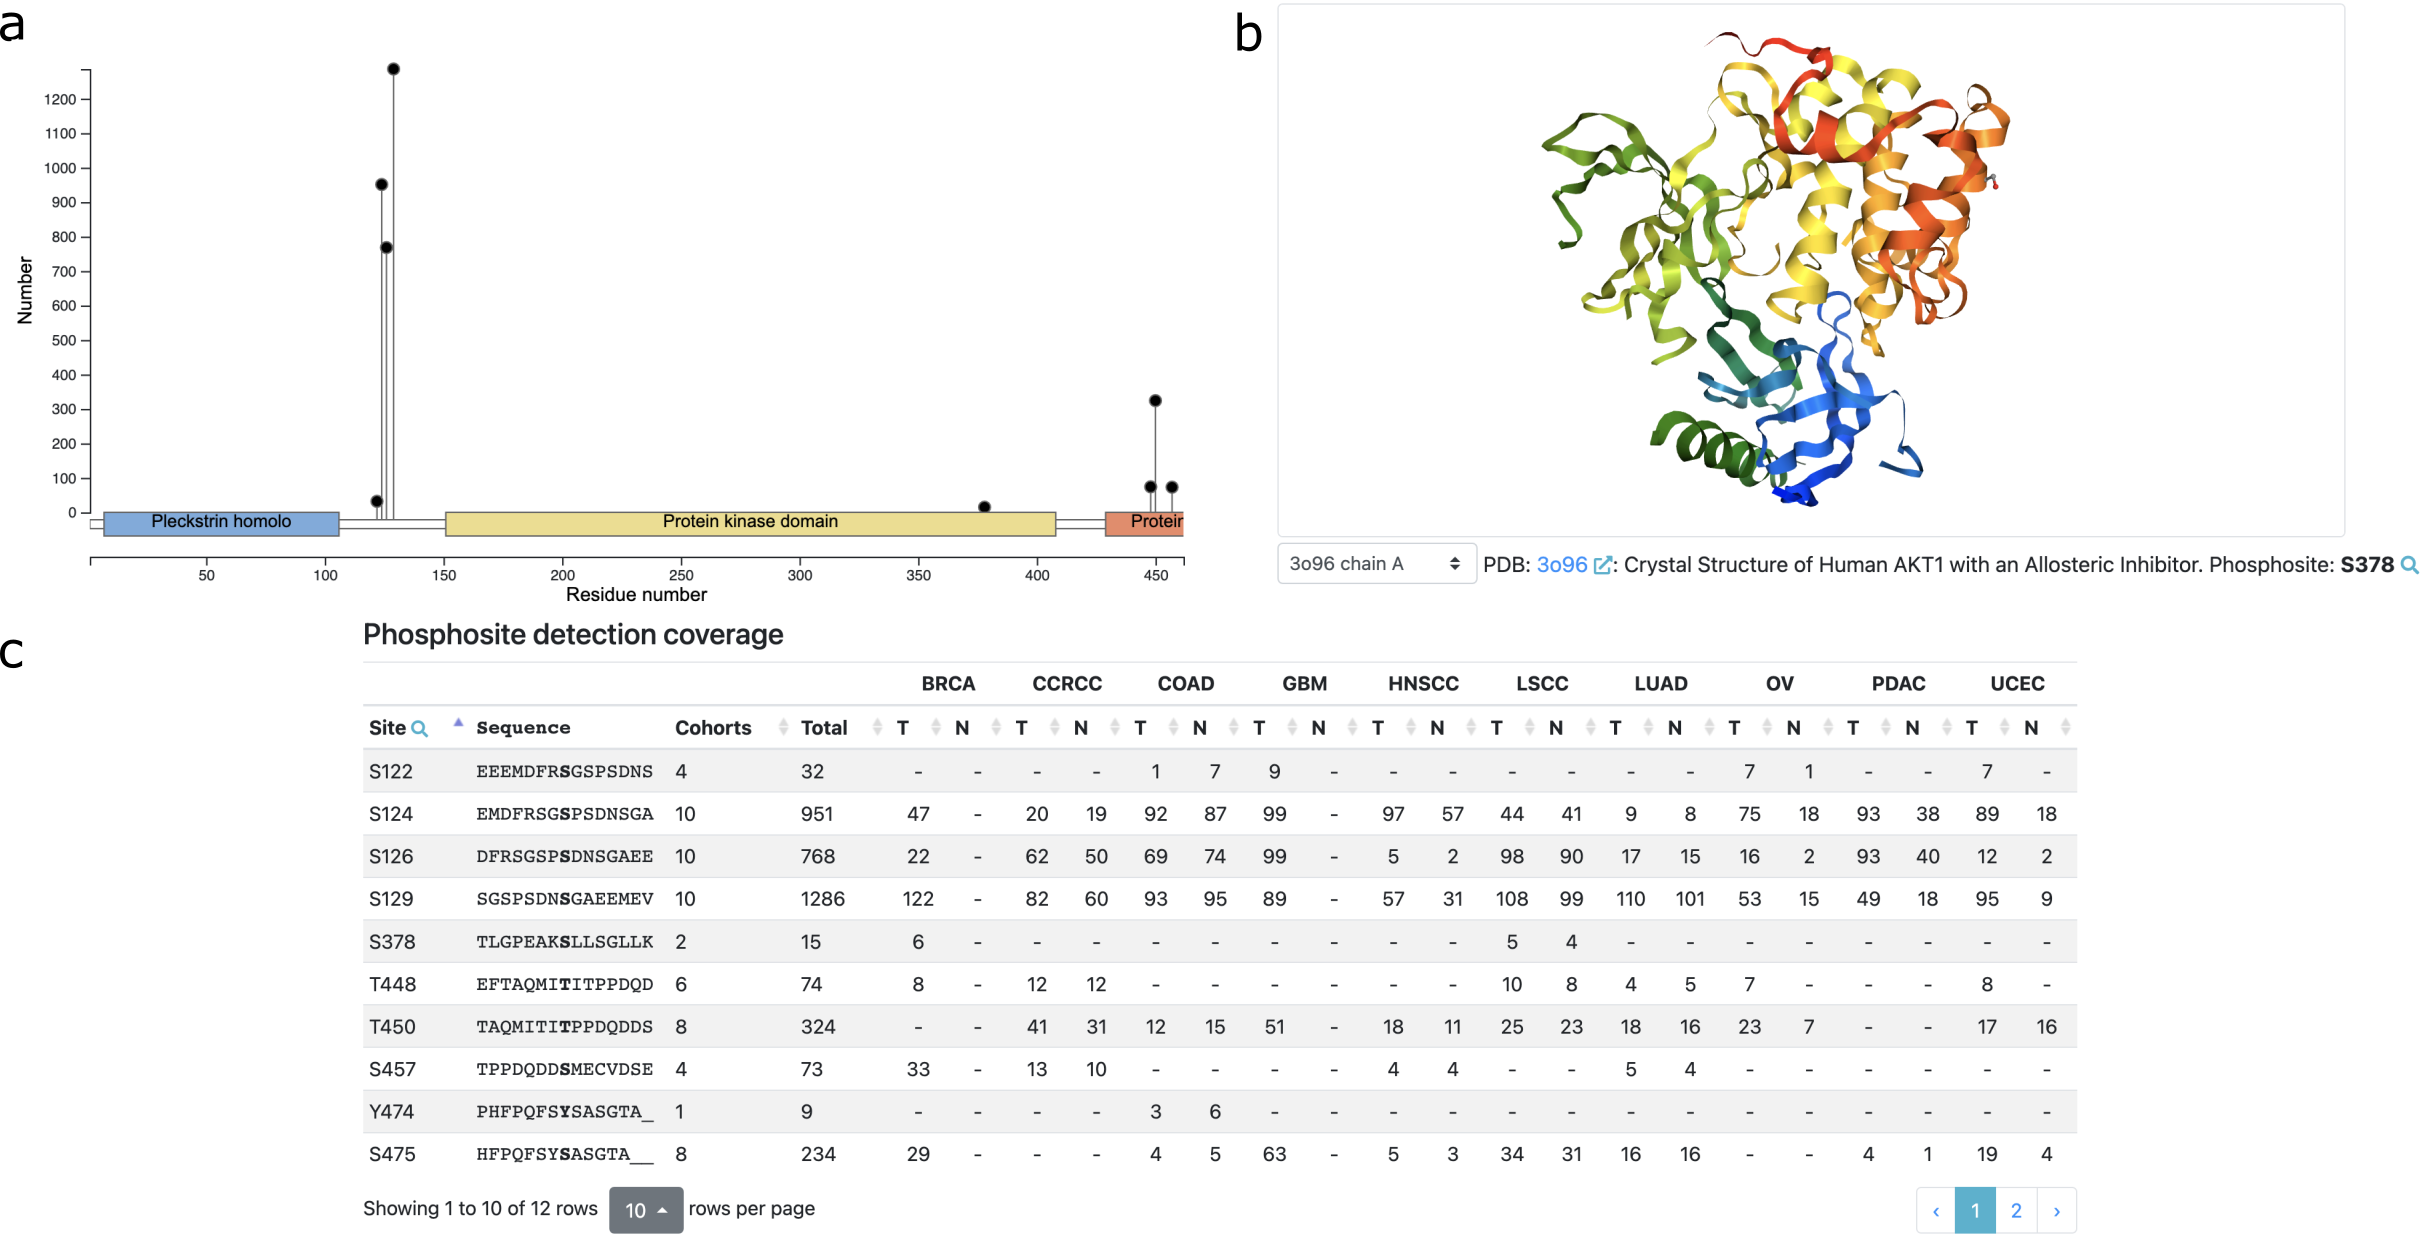
The protein page is linked from the protein product section in gene page and it includes information for all experimentally identified phosphosites from the proteins in CPTAC studies, divided into seven sections. The first section uses a zoomable lollipop plot and a 3D protein structure viewer to visualize all identified phosphosites in the context of protein sequence, domains, and structure (Fig. 4). The site detection section provides further information on the detection frequencies within and across all cancer types in an interactive table. The sections for tumor vs normal comparison and phenotype and mutation association are similar to those in the gene pages, except for using phosphosites, rather than genes, as the units for analysis. The cis-association section visualizes associations between individual phosphosites and measurements at protein, mRNA, copy number and methylation levels, respectively, in a correlogram, which is useful for prioritizing phosphosites that are regulated independent of protein abundance. The last two sections use interactive tables to display association results between phosphosites and all kinases and all phosphatases, respectively, which may help prioritize direct or indirect upstream regulators of the phosphosites.
Mutation and Phenotype page
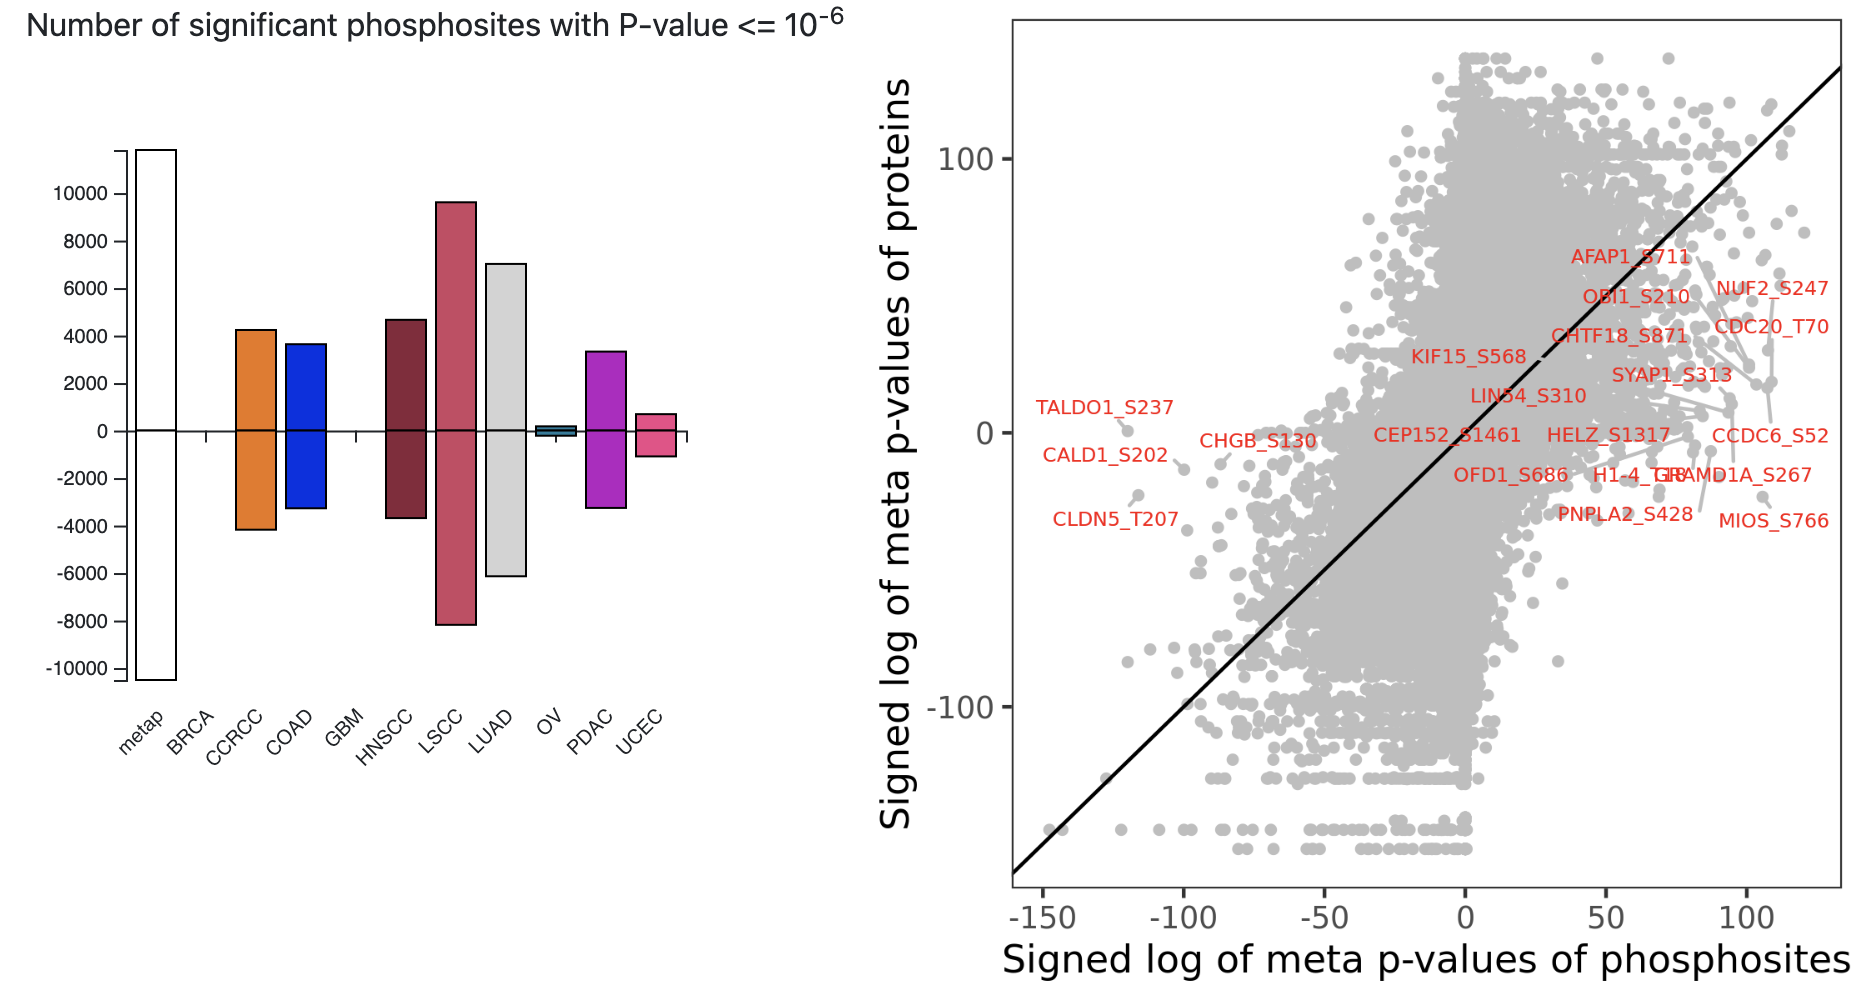
Users can also browse precomputed results in the phenotype or mutation pages. These pages first introduce basic information of the phenotype or mutation, such as the method used to quantify a molecular phenotype. Next, association results of all genes and phosphosites with the phenotype or mutation are presented. Four two-sided bar charts summarize the numbers of significant associations (p < 1.0e-6) in each cancer type at copy number, mRNA, protein, and phosphosite levels, respectively. Moreover, one scatter plot comparing mRNA and protein associations and another comparing protein and phosphosite associations (Fig. 5) help prioritize protein and phosphosite-specific associations, respectively. Detailed association results are displayed in two interactive tables for copy number/mRNA/protein and phosphosites, respectively. Similar to these pages, a specific page is dedicated to tumor vs normal comparison and can be directly accessed from the homepage.