Basic information
- Phenotype
- chromosomal instability
- Description
- The chromosomal instability score is a measure of the overall copy number aberrations across the whole genome. It was calculated as the sum of the absolute CNV log2 ratios for each genome segment in the autosomes weighted by the segment length.
- Method
- The CIN score reflects the overall copy number aberration across the whole genome. From the segmentation result, we used a weighted-sum approach to summarize the chromosome instability for each sample (PMID: 31031003). The absolute segment level log2 ratios of all segments (indicating the copy number aberration of these segments) within a chromosome were weighted by the segment length and summed up to derive the instability score for the chromosome. The genome-wide chromosome instability index was calculated by summing up the instability score of all 22 autosomes. The R package genomicWidgets was used to implement the method (https://github.com/bzhanglab/genomicWidgets).
Gene association
Number of significant genes with P-value ≤ 10-6 for each cohorts are summarized in bar plots. The scatter plot highlights significant associations diven by protein rather than mRNA abundance.
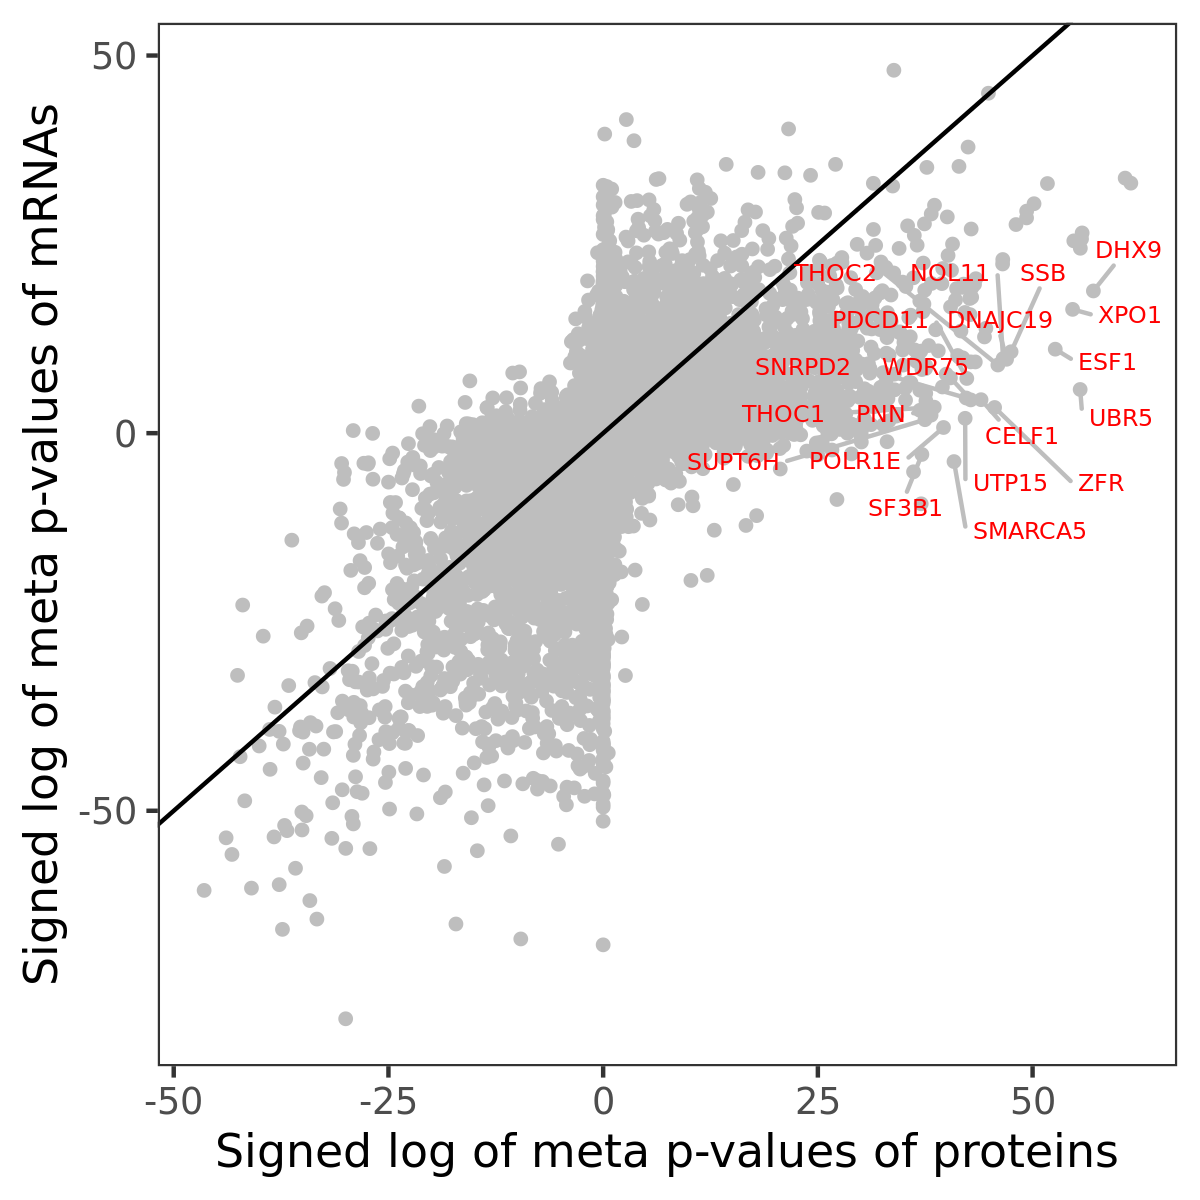
Association of protein abundance of genes
| Signed p-values | |||||||||||
|---|---|---|---|---|---|---|---|---|---|---|---|
| Gene | Meta P | BRCA | CCRCC | COAD | GBM | HNSCC | LSCC | LUAD | OV | PDAC | UCEC |
Gene set enrichment analysis
Submit genes and the common logarithm of the p-values of their association with chromosomal instability to WebGestalt.
Phosphosite association
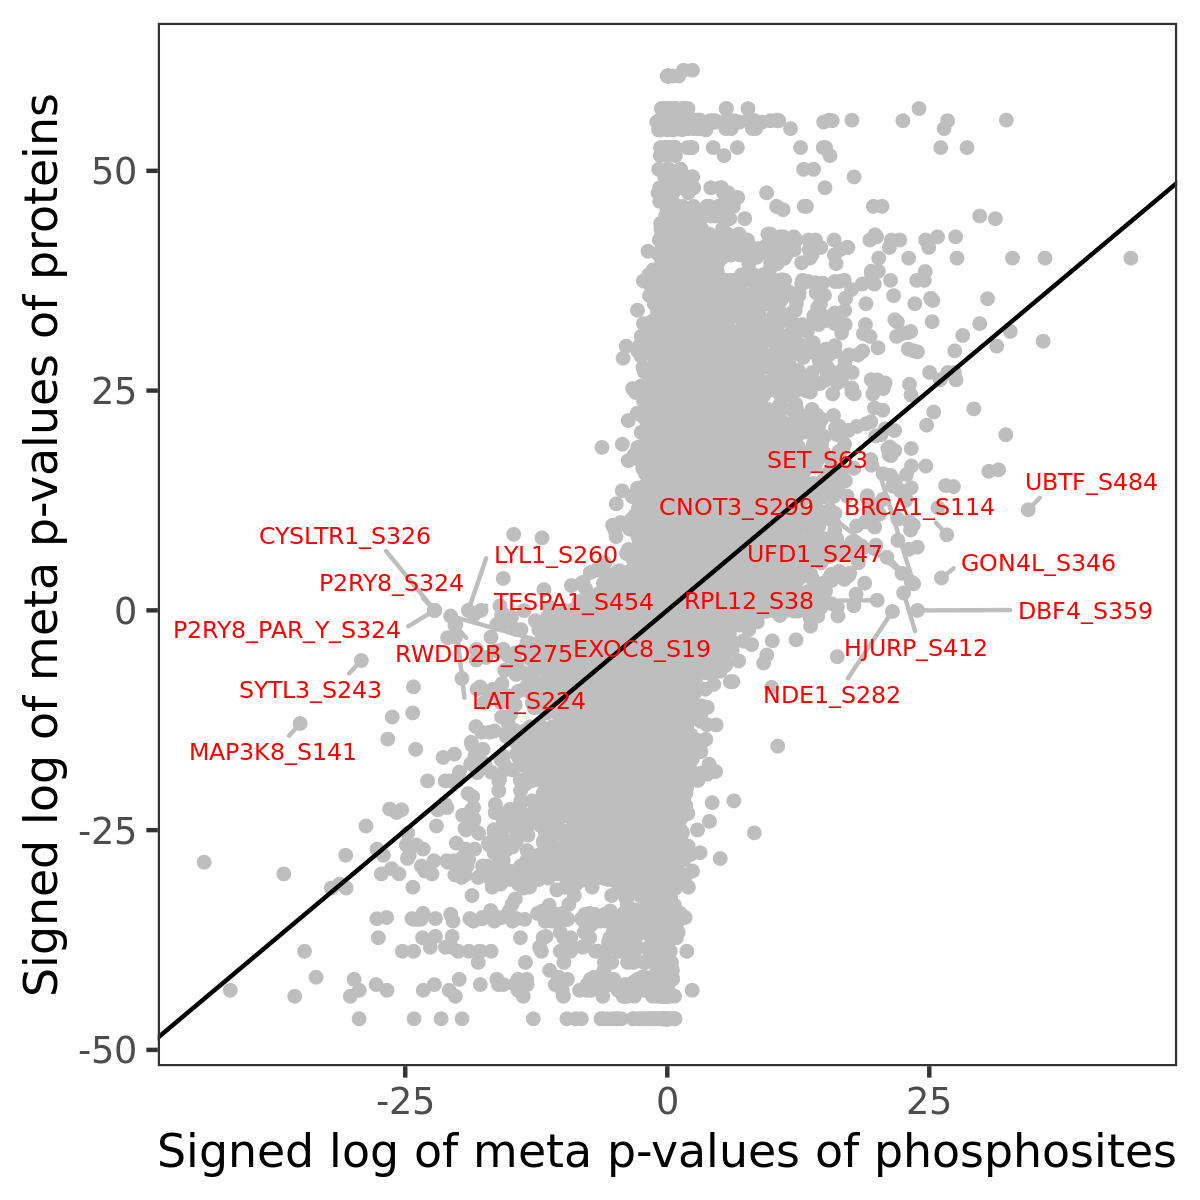
Number of significant genes with P-value ≤ 10-6 for each cohorts are summarized in the bar plot. The scatter plot highlights significant associations diven by phosphorylation rather than protein abundance.
| Signed p-values | |||||||||||||
|---|---|---|---|---|---|---|---|---|---|---|---|---|---|
| Gene | Protein | Site | Meta P | BRCA | CCRCC | COAD | GBM | HNSCC | LSCC | LUAD | OV | PDAC | UCEC |
Gene set enrichment analysis
Submit phosphorylation sites and the common logarithm of the p-values of their association with chromosomal instability to WebGestalt.