Basic information
- Phenotype
- ESTIMATE: ESTIMATEScore
- Description
- Score that represents the total amount of immune and stroma infiltration (tumor impurity) in a tumor sample. Calculated as the sum of the ESTIMATE Immune and Stromal scores.
- Source
- https://www.nature.com/articles/ncomms3612
- Method
- The ESTIMATE scores reflecting the overall immune and stromal infiltration were calculated by the R package ESTIMATE (PMID: 24113773) using the normalized RNA expression data (RSEM). We removed genes with 0 expression in >=50% samples of a cohort.
Gene association
Number of significant genes with P-value ≤ 10-6 for each cohorts are summarized in bar plots. The scatter plot highlights significant associations diven by protein rather than mRNA abundance.
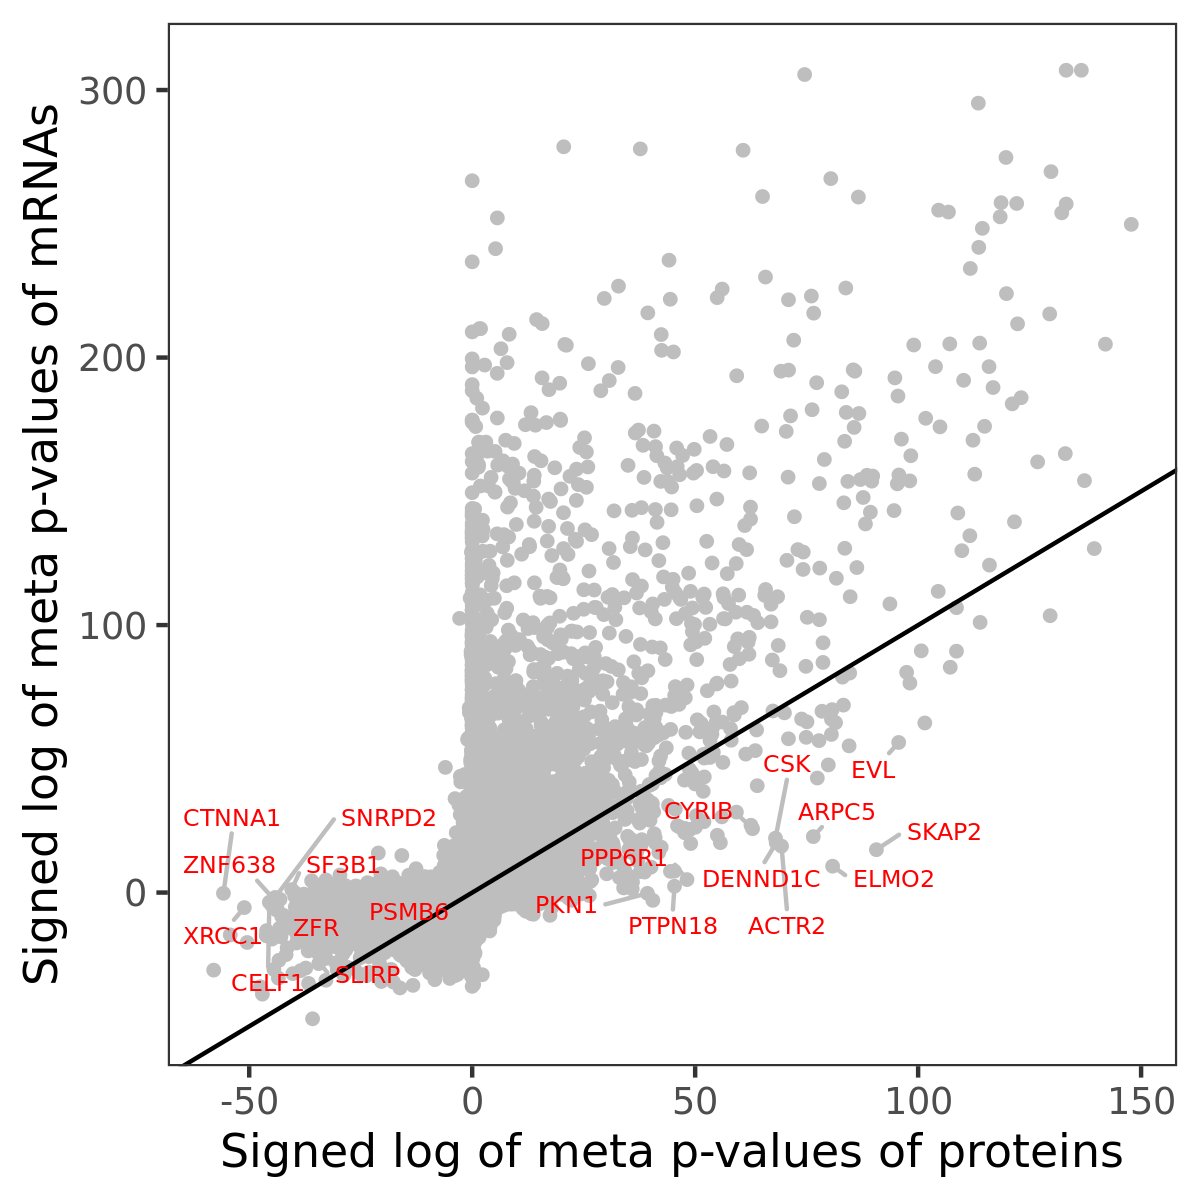
Association of protein abundance of genes
| Signed p-values | |||||||||||
|---|---|---|---|---|---|---|---|---|---|---|---|
| Gene | Meta P | BRCA | CCRCC | COAD | GBM | HNSCC | LSCC | LUAD | OV | PDAC | UCEC |
Gene set enrichment analysis
Submit genes and the common logarithm of the p-values of their association with ESTIMATE: ESTIMATEScore to WebGestalt.
Phosphosite association
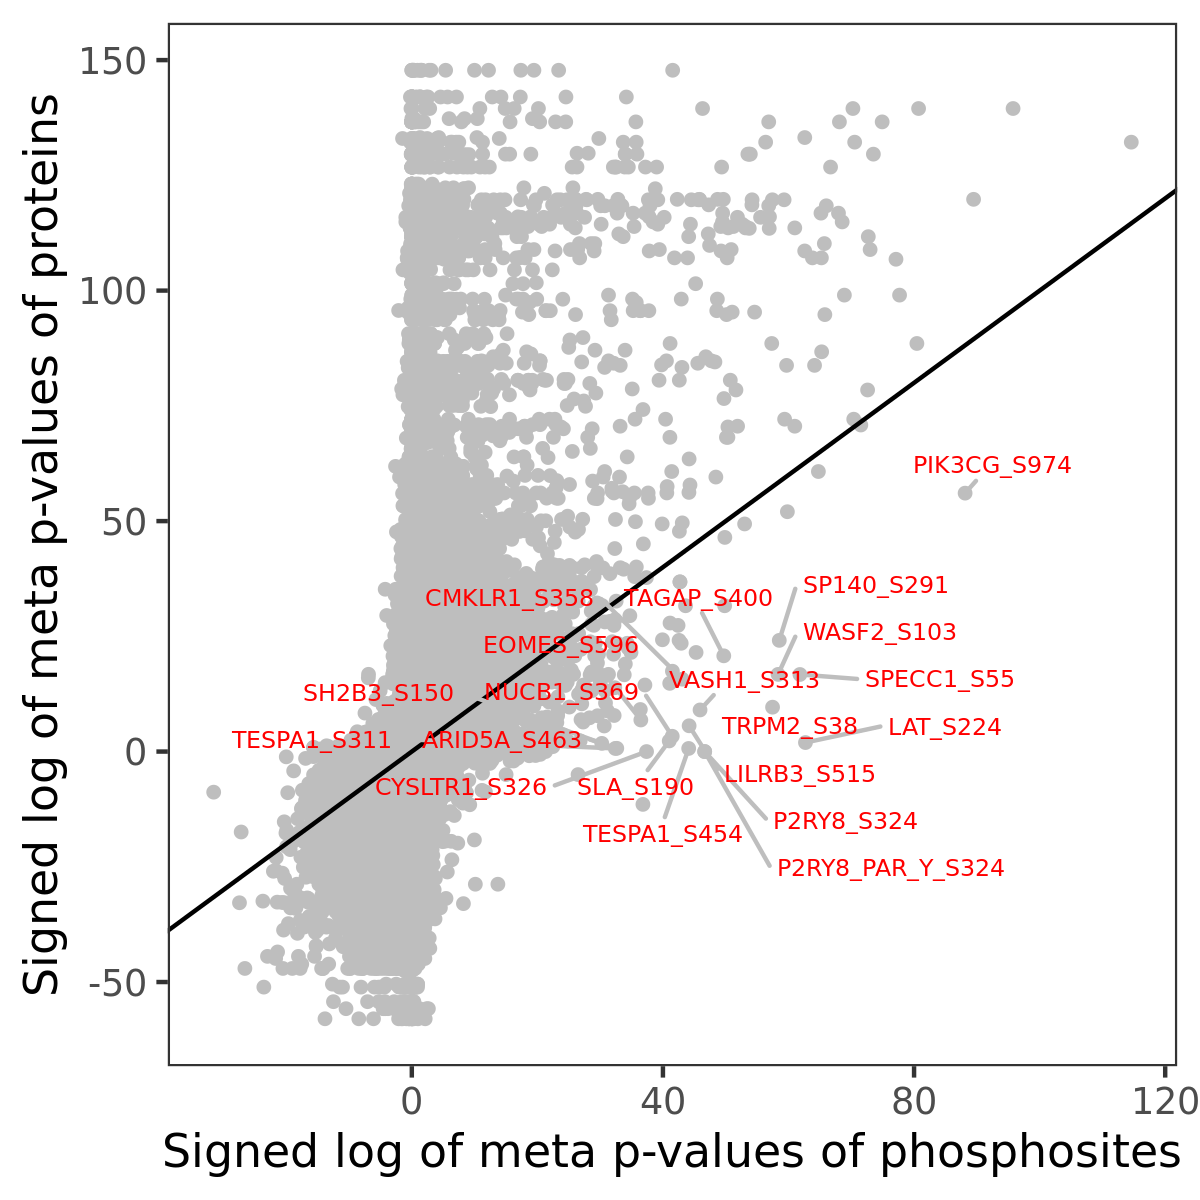
Number of significant genes with P-value ≤ 10-6 for each cohorts are summarized in the bar plot. The scatter plot highlights significant associations diven by phosphorylation rather than protein abundance.
| Signed p-values | |||||||||||||
|---|---|---|---|---|---|---|---|---|---|---|---|---|---|
| Gene | Protein | Site | Meta P | BRCA | CCRCC | COAD | GBM | HNSCC | LSCC | LUAD | OV | PDAC | UCEC |
Gene set enrichment analysis
Submit phosphorylation sites and the common logarithm of the p-values of their association with ESTIMATE: ESTIMATEScore to WebGestalt.