Basic information
- Phenotype
- HALLMARK_MITOTIC_SPINDLE
- Description
- Enrichment score representing genes important for mitotic spindle assembly. The score was calculated using ssGSEA on the RNA data (Z-score transformed coding genes with expression in at least 50% of the samples in a cohort).
- Source
- http://www.gsea-msigdb.org/gsea/msigdb/cards/HALLMARK_MITOTIC_SPINDLE.html
- Method
- Single sample gene set enrichment analysis (ssGSEA) was performed for each cancer type using gene-wise Z-scores of the RNA expression data (RSEM) for the MSigDB Hallmark gene sets v7.0 (PMID: 26771021) via the ssGSEA2.0 R package (PMID: 30563849). RNA data were filtered to coding genes with < 50% 0 expression. (Parameters: sample.norm.type="rank", weight=0.75, statistic="area.under.RES", nperm=1000, min.overlap=10). Pathway activity scores are normalized enrichment scores from ssGSEA.
- Genes
-
- ABL1
- ABR
- ACTN4
- AKAP13
- ALMS1
- ALS2
- ANLN
- APC
- ARAP3
- ARF6
- ARFGEF1
- ARFIP2
- ARHGAP10
- ARHGAP27
- ARHGAP29
- ARHGAP4
- ARHGAP5
- ARHGDIA
- ARHGEF11
- ARHGEF12
- ARHGEF2
- ARHGEF3
- ARHGEF7
- ARL8A
- ATG4B
- AURKA
- BCAR1
- BCL2L11
- BCR
- BIN1
- BIRC5
- BRCA2
- BUB1
- CAPZB
- CCDC88A
- CCNB2
- CD2AP
- CDC27
- CDC42
- CDC42BPA
- CDC42EP1
- CDC42EP2
- CDC42EP4
- CDK1
- CDK5RAP2
- CENPE
- CENPF
- CENPJ
- CEP131
- CEP192
- CEP250
- CEP57
- CEP72
- CKAP5
- CLASP1
- CLIP1
- CLIP2
- CNTRL
- CNTROB
- CSNK1D
- CTTN
- CYTH2
- DLG1
- DLGAP5
- DOCK2
- DOCK4
- DST
- DYNC1H1
- DYNLL2
- ECT2
- EPB41
- EPB41L2
- ESPL1
- EZR
- FARP1
- FBXO5
- FGD4
- FGD6
- FLNA
- FLNB
- FSCN1
- GEMIN4
- GSN
- HDAC6
- HOOK3
- INCENP
- ITSN1
- KATNA1
- KATNB1
- KIF11
- KIF15
- KIF1B
- KIF20B
- KIF22
- KIF2C
- KIF3B
- KIF3C
- KIF4A
- Array
- KIF5B
- KIFAP3
- KLC1
- KNTC1
- KPTN
- LATS1
- LLGL1
- LMNB1
- LRPPRC
- MAP1S
- MAP3K11
- MAPRE1
- MARCKS
- MARK4
- MID1
- MID1IP1
- MYH10
- MYH9
- MYO1E
- MYO9B
- NCK1
- NCK2
- NDC80
- NEDD9
- NEK2
- NET1
- NF1
- NIN
- NOTCH2
- NUMA1
- NUSAP1
- OPHN1
- PAFAH1B1
- PALLD
- PCGF5
- PCM1
- PCNT
- PDLIM5
- PIF1
- PKD2
- PLEKHG2
- PLK1
- PPP4R2
- PRC1
- PREX1
- PXN
- RAB3GAP1
- RABGAP1
- RACGAP1
- RALBP1
- RANBP9
- RAPGEF5
- RAPGEF6
- RASA1
- RASA2
- RASAL2
- RFC1
- RHOF
- RHOT2
- RICTOR
- ROCK1
- SAC3D1
- SASS6
- SEPTIN9
- SHROOM1
- SHROOM2
- SMC1A
- SMC3
- SMC4
- SORBS2
- SOS1
- SPTAN1
- SPTBN1
- SSH2
- STAU1
- STK38L
- SUN2
- SYNPO
- TAOK2
- TBCD
- TIAM1
- TLK1
- TOP2A
- TPX2
- TRIO
- TSC1
- TTK
- TUBA4A
- TUBD1
- TUBGCP2
- TUBGCP3
- TUBGCP5
- TUBGCP6
- UXT
- VCL
- WASF1
- WASF2
- WASL
- YWHAE
- More...
Gene association
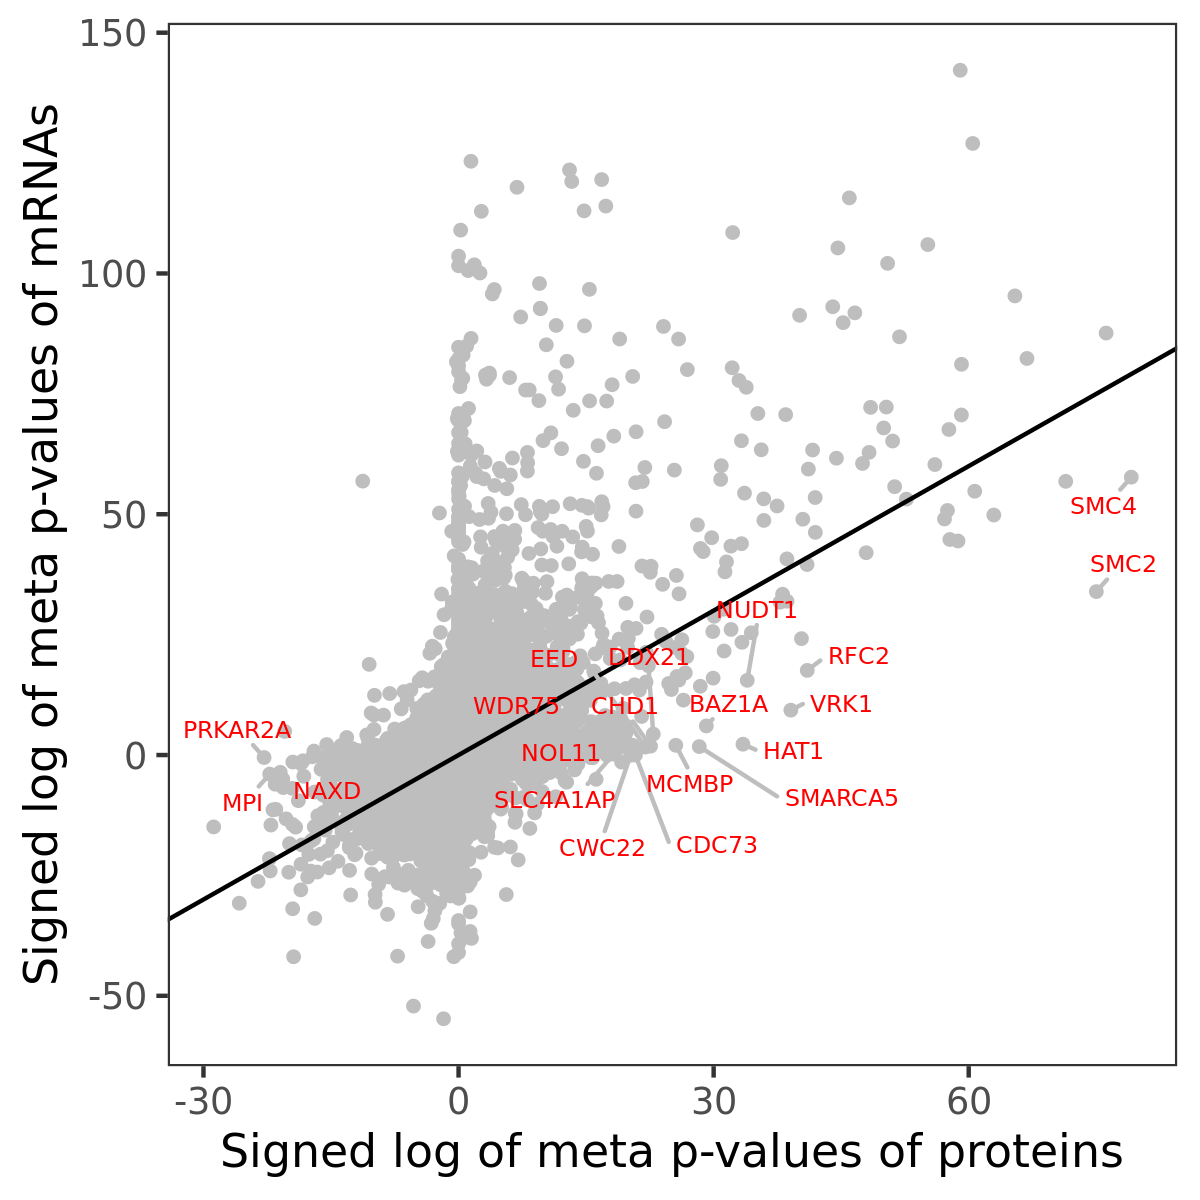
Number of significant genes with P-value ≤ 10-6 for each cohorts are summarized in bar plots. The scatter plot highlights significant associations diven by protein rather than mRNA abundance.

Association of protein abundance of genes
| Signed p-values | |||||||||||
|---|---|---|---|---|---|---|---|---|---|---|---|
| Gene | Meta P | BRCA | CCRCC | COAD | GBM | HNSCC | LSCC | LUAD | OV | PDAC | UCEC |
Gene set enrichment analysis
Submit genes and the common logarithm of the p-values of their association with HALLMARK_MITOTIC_SPINDLE to WebGestalt.
Phosphosite association
Number of significant genes with P-value ≤ 10-6 for each cohorts are summarized in the bar plot. The scatter plot highlights significant associations diven by phosphorylation rather than protein abundance.

| Signed p-values | |||||||||||||
|---|---|---|---|---|---|---|---|---|---|---|---|---|---|
| Gene | Protein | Site | Meta P | BRCA | CCRCC | COAD | GBM | HNSCC | LSCC | LUAD | OV | PDAC | UCEC |
Gene set enrichment analysis
Submit phosphorylation sites and the common logarithm of the p-values of their association with HALLMARK_MITOTIC_SPINDLE to WebGestalt.