Basic information
- Phenotype
- PROGENy: p53
- Description
- Score representing the activity of the p53 pathway. It was calculated using the PROGENy tool on the RNA data (genes with mean FPKM expression >0).
- Source
- https://www.nature.com/articles/s41467-017-02391-6; https://www.sciencedirect.com/science/article/abs/pii/S1874939919302287?via%3Dihub
- Method
- The PROGENy scores were inferred using the R package progeny (V1.10.0) (PMID: 29295995) with default parameters using the RNA expression data (FPKM). Genes with mean expression = 0 in a cohort were removed from the analysis.
- Genes
-
- ACER2
- AK1
- AKR1B10
- ANKRA2
- ARHGAP11A
- BLOC1S2
- C2orf66
- CABYR
- Array
- CARNS1
- CCDC90B
- CDIP1
- CDKN1A
- CEL
- CES2
- CLCA2
- Array
- CMBL
- CSMD3
- CSTA
- CYFIP2
- CYP4F2
- CYSRT1
- DDB2
- DGKA
- DQX1
- DRAXIN
- EDA2R
- EFNB1
- EI24
- FAM13C
- Array
- FAS
- FBXO22
- FBXW7
- FDXR
- GDF15
- GLS2
- GPR87
- GRHL3
- GRIN2C
- GRIP2
- INPP1
- ISCU
- KANK3
- KLHDC7A
- LCE1B
- LCE1C
- MDM2
- MUC19
- NADSYN1
- NECTIN4
- NRF1
- PADI4
- PDE6C
- PGAP1
- PGF
- PHLDA3
- PIDD1
- PLTP
- POLH
- PPM1D
- PRKAB1
- RETSAT
- Array
- RINL
- RPS27L
- RRM2B
- SCN3B
- SERPINB5
- SESN1
- SLC44A5
- SLC52A1
- SMIM10L2A
- SPATA18
- SRGAP3
- STAG1
- STX6
- TEX37
- TIGAR
- TMEM63B
- TNFRSF10B
- TP53I3
- TP53INP1
- TRIAP1
- WDR63
- XPC
- ZMAT3
- ZNF337
- ZNF561
- ZNF79
- ZNF83
- ZSCAN4
- More...
Gene association
Number of significant genes with P-value ≤ 10-6 for each cohorts are summarized in bar plots. The scatter plot highlights significant associations diven by protein rather than mRNA abundance.
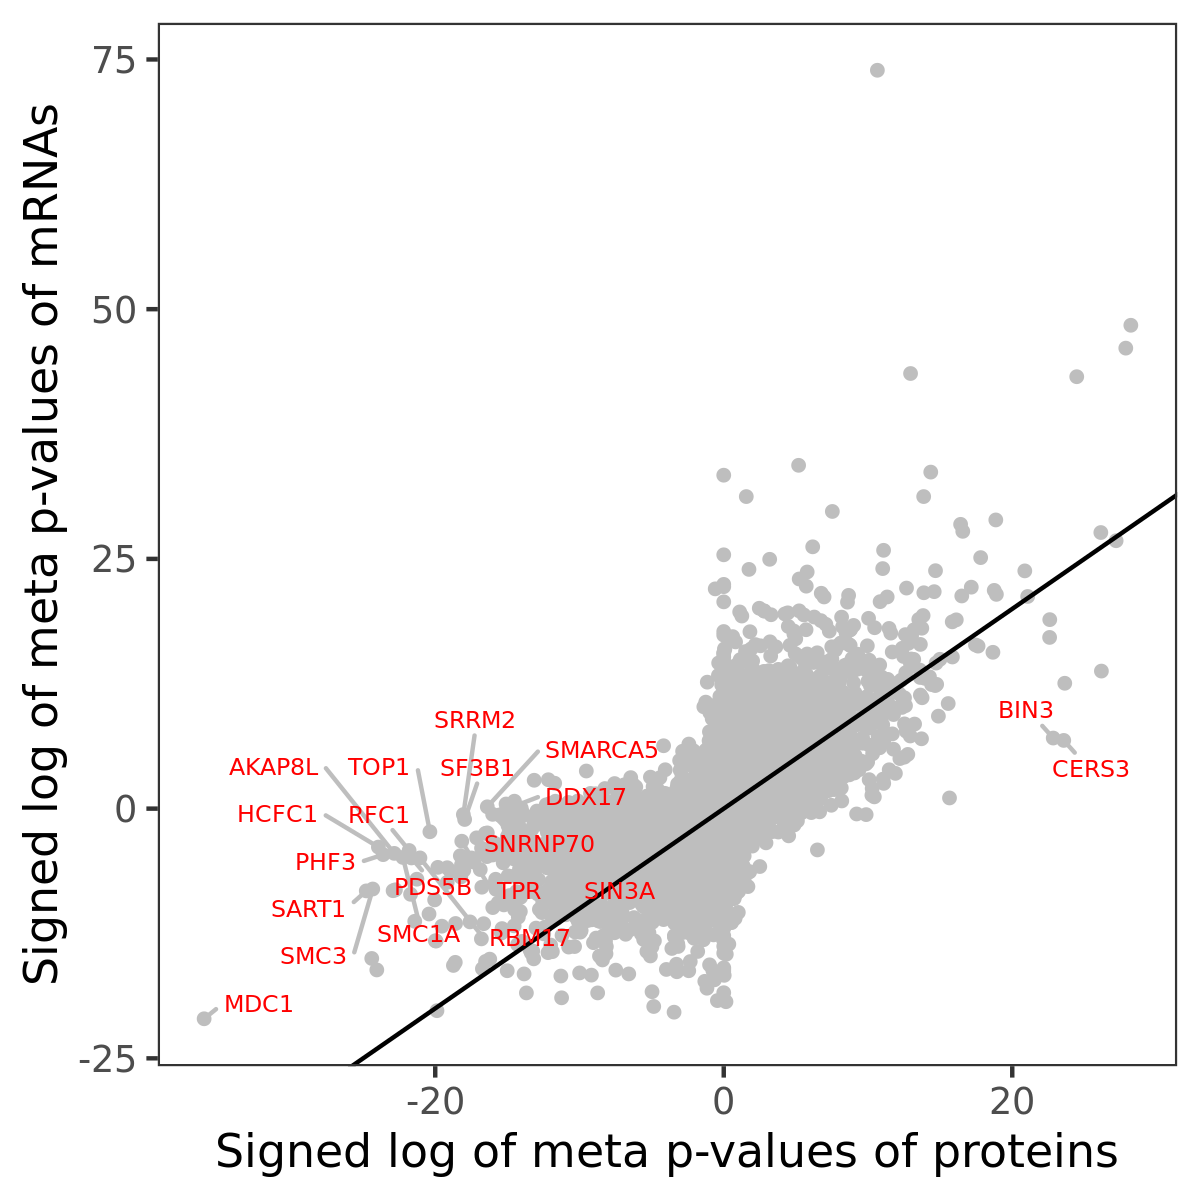
Association of protein abundance of genes
| Signed p-values | |||||||||||
|---|---|---|---|---|---|---|---|---|---|---|---|
| Gene | Meta P | BRCA | CCRCC | COAD | GBM | HNSCC | LSCC | LUAD | OV | PDAC | UCEC |
Gene set enrichment analysis
Submit genes and the common logarithm of the p-values of their association with PROGENy: p53 to WebGestalt.
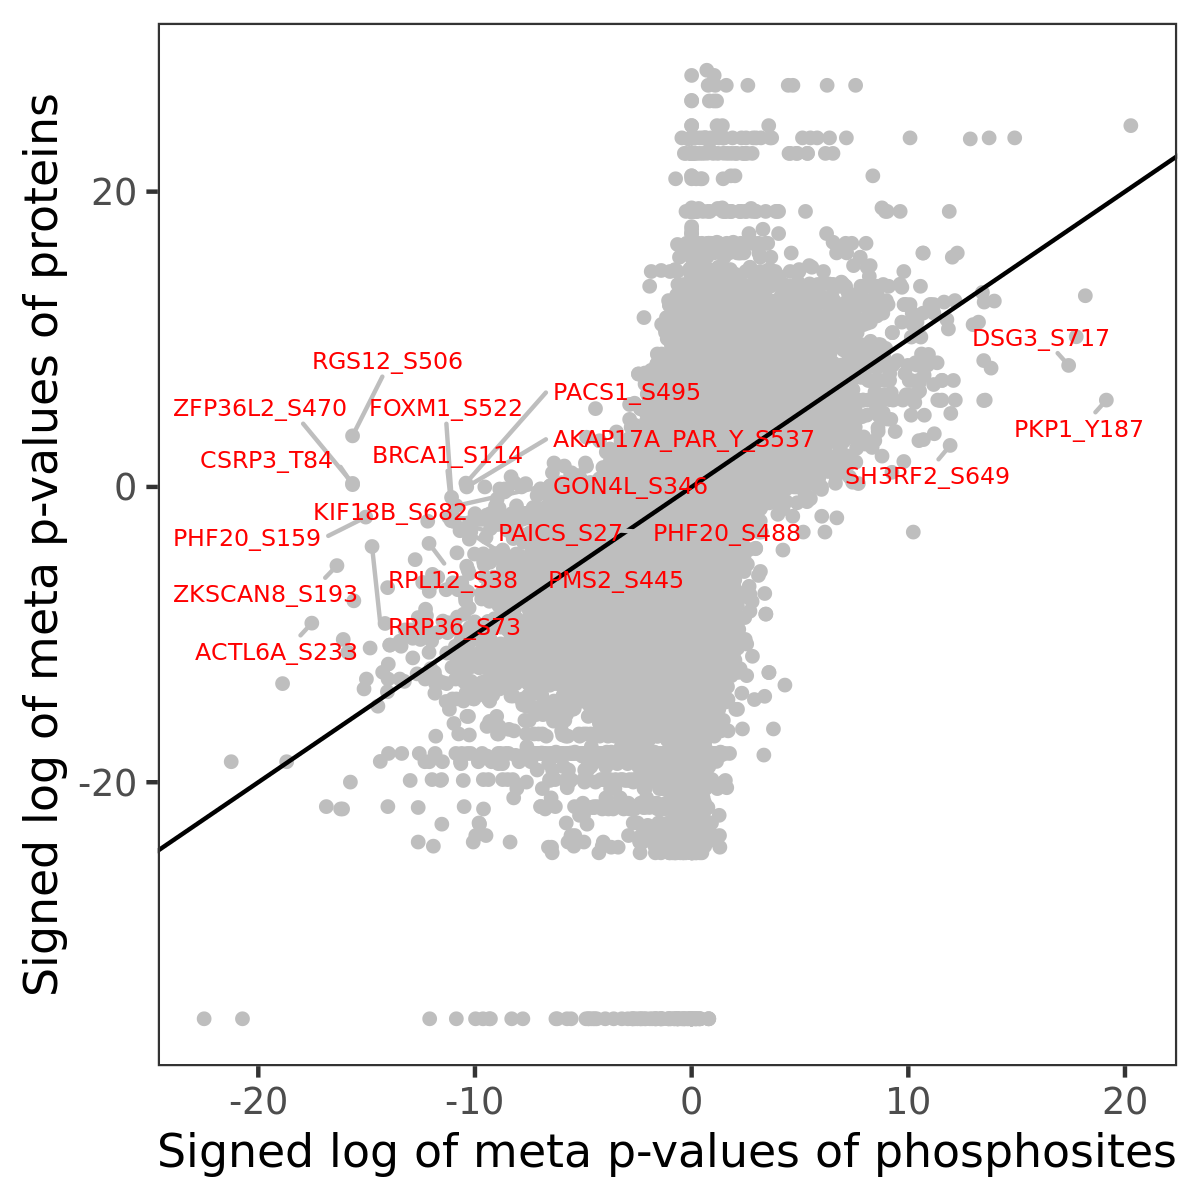
Phosphosite association
Number of significant genes with P-value ≤ 10-6 for each cohorts are summarized in the bar plot. The scatter plot highlights significant associations diven by phosphorylation rather than protein abundance.
| Signed p-values | |||||||||||||
|---|---|---|---|---|---|---|---|---|---|---|---|---|---|
| Gene | Protein | Site | Meta P | BRCA | CCRCC | COAD | GBM | HNSCC | LSCC | LUAD | OV | PDAC | UCEC |
Gene set enrichment analysis
Submit phosphorylation sites and the common logarithm of the p-values of their association with PROGENy: p53 to WebGestalt.