Basic information
- Phenotype
- SBS13 (APOBEC activity)
- Description
- Activity scores for the SBS13 mutation signature. SBS13 may result from activity of cytidine deaminases.
- Source
- https://cancer.sanger.ac.uk/signatures/sbs/sbs13/
- Method
- The R package SigProfilerMatrixGeneratorR (version 1.0) was used to call mutation signatures from all whole exome-derived somatic mutation data. The maximum number of signatures was set to 10 and nmf replicates was set to 100. The activity scores of the decomposed solution suggested by SigProfilerMatrixGenerator were used as signature scores.
Gene association
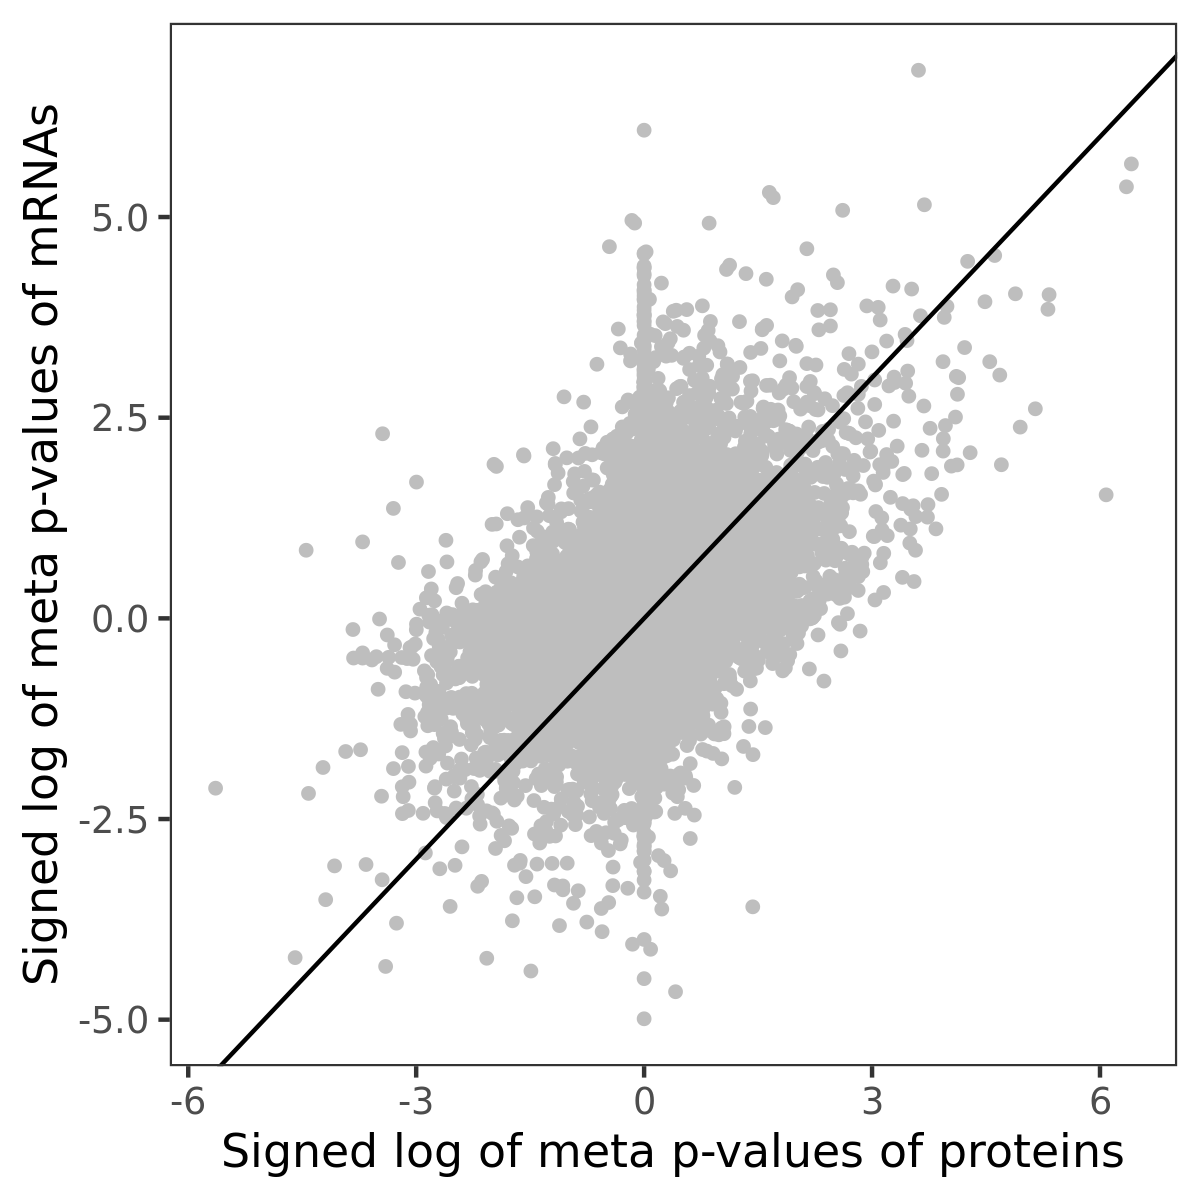
Number of significant genes with P-value ≤ 10-6 for each cohorts are summarized in bar plots. The scatter plot highlights significant associations diven by protein rather than mRNA abundance.
Association of protein abundance of genes
| Signed p-values | |||||||||||
|---|---|---|---|---|---|---|---|---|---|---|---|
| Gene | Meta P | BRCA | CCRCC | COAD | GBM | HNSCC | LSCC | LUAD | OV | PDAC | UCEC |
Gene set enrichment analysis
Submit genes and the common logarithm of the p-values of their association with SBS13 (APOBEC activity) to WebGestalt.
Phosphosite association
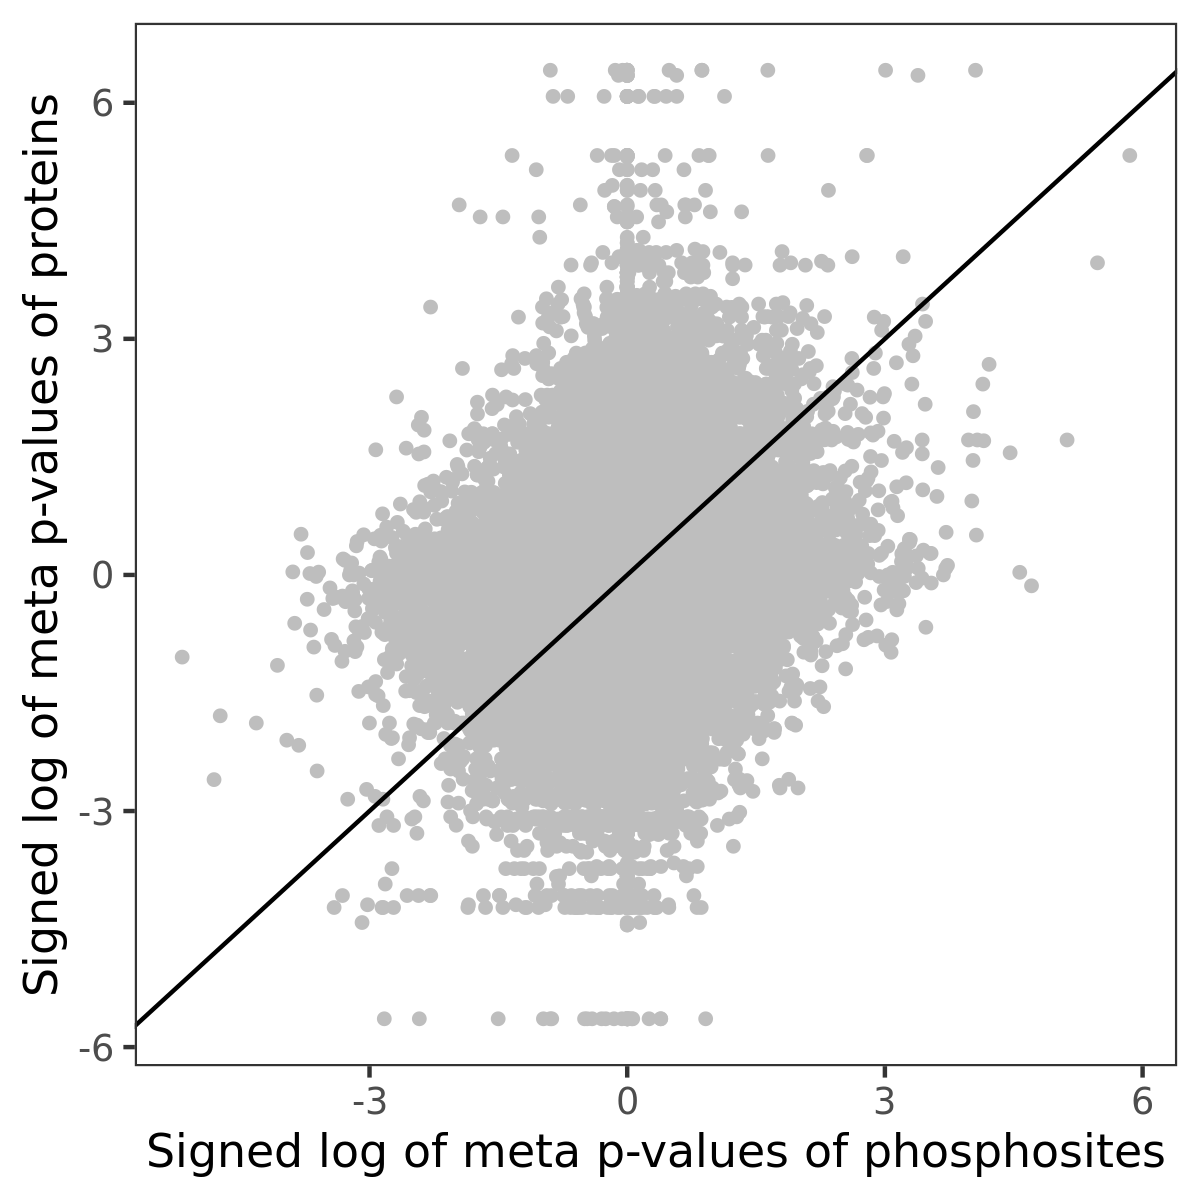
Number of significant genes with P-value ≤ 10-6 for each cohorts are summarized in the bar plot. The scatter plot highlights significant associations diven by phosphorylation rather than protein abundance.
| Signed p-values | |||||||||||||
|---|---|---|---|---|---|---|---|---|---|---|---|---|---|
| Gene | Protein | Site | Meta P | BRCA | CCRCC | COAD | GBM | HNSCC | LSCC | LUAD | OV | PDAC | UCEC |
Gene set enrichment analysis
Submit phosphorylation sites and the common logarithm of the p-values of their association with SBS13 (APOBEC activity) to WebGestalt.