Basic information
- Phenotype
- Clinical: progression_free_survival
- Description
- Number of days from the initial diagnosis until the date of last contact or diagnosis of a new tumor event.
- Method
- Cases with follow up time or a new event within 10 days of the initial diagnosis were excluded.
Gene association
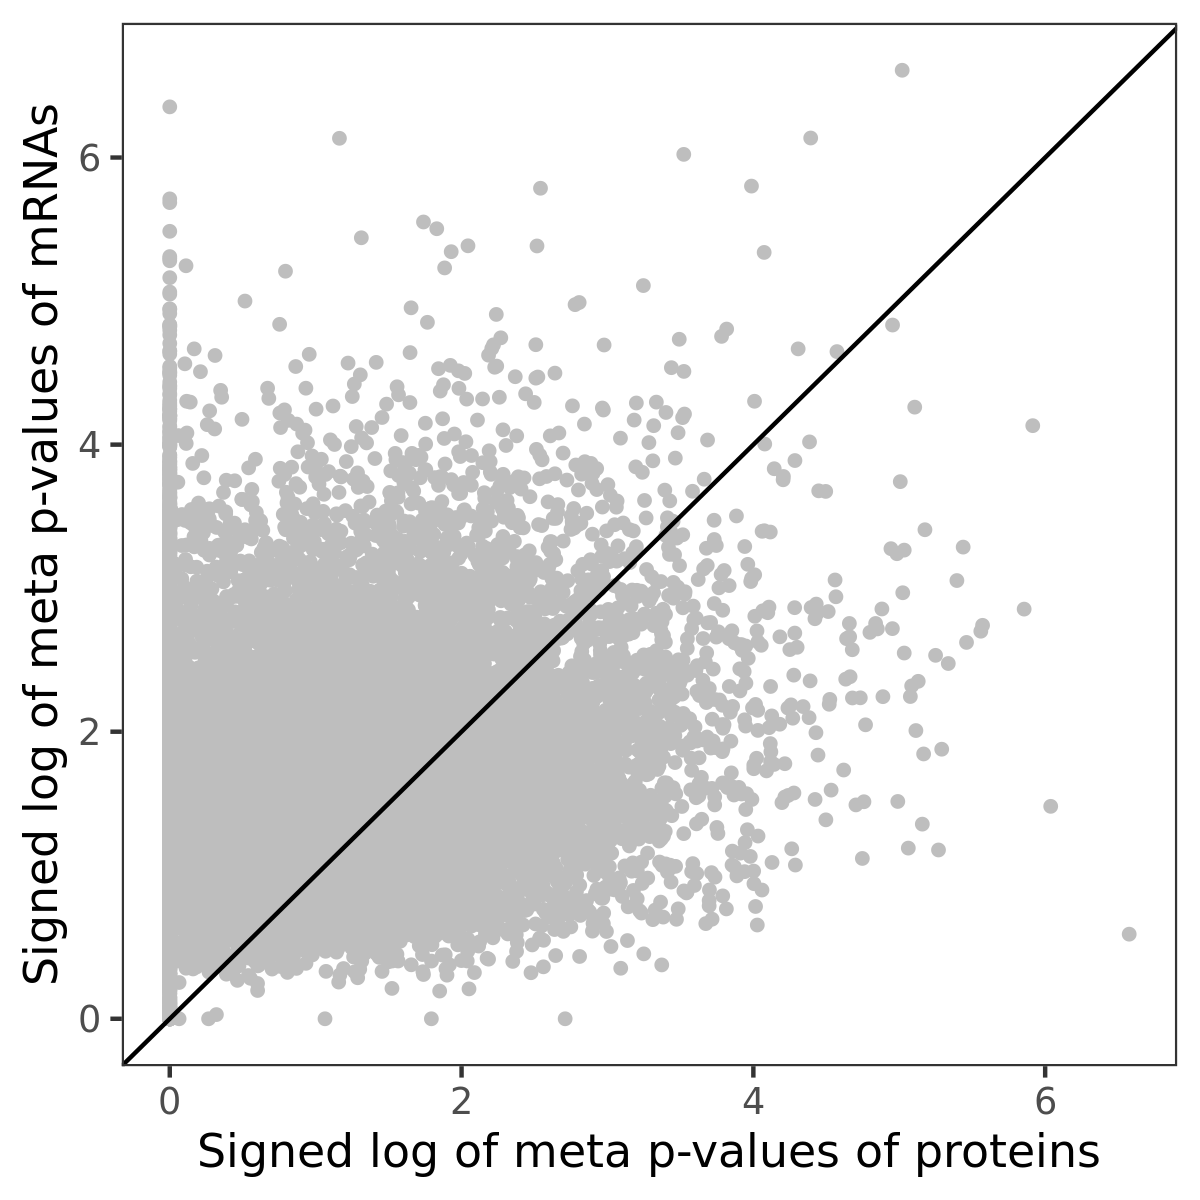
Number of significant genes with P-value ≤ 10-6 for each cohorts are summarized in bar plots. The scatter plot highlights significant associations diven by protein rather than mRNA abundance.
Association of protein abundance of genes
Signed p-values | ||||||||||||
|---|---|---|---|---|---|---|---|---|---|---|---|---|
Gene | Meta P | BRCA | CCRCC | COAD | GBM | HNSCC | LSCC | LUAD | OV | PDAC | UCEC | |
| No matching records found | ||||||||||||
Gene set enrichment analysis
Submit genes and the common logarithm of the p-values of their association with Clinical: progression_free_survival to WebGestalt.
Phosphosite association
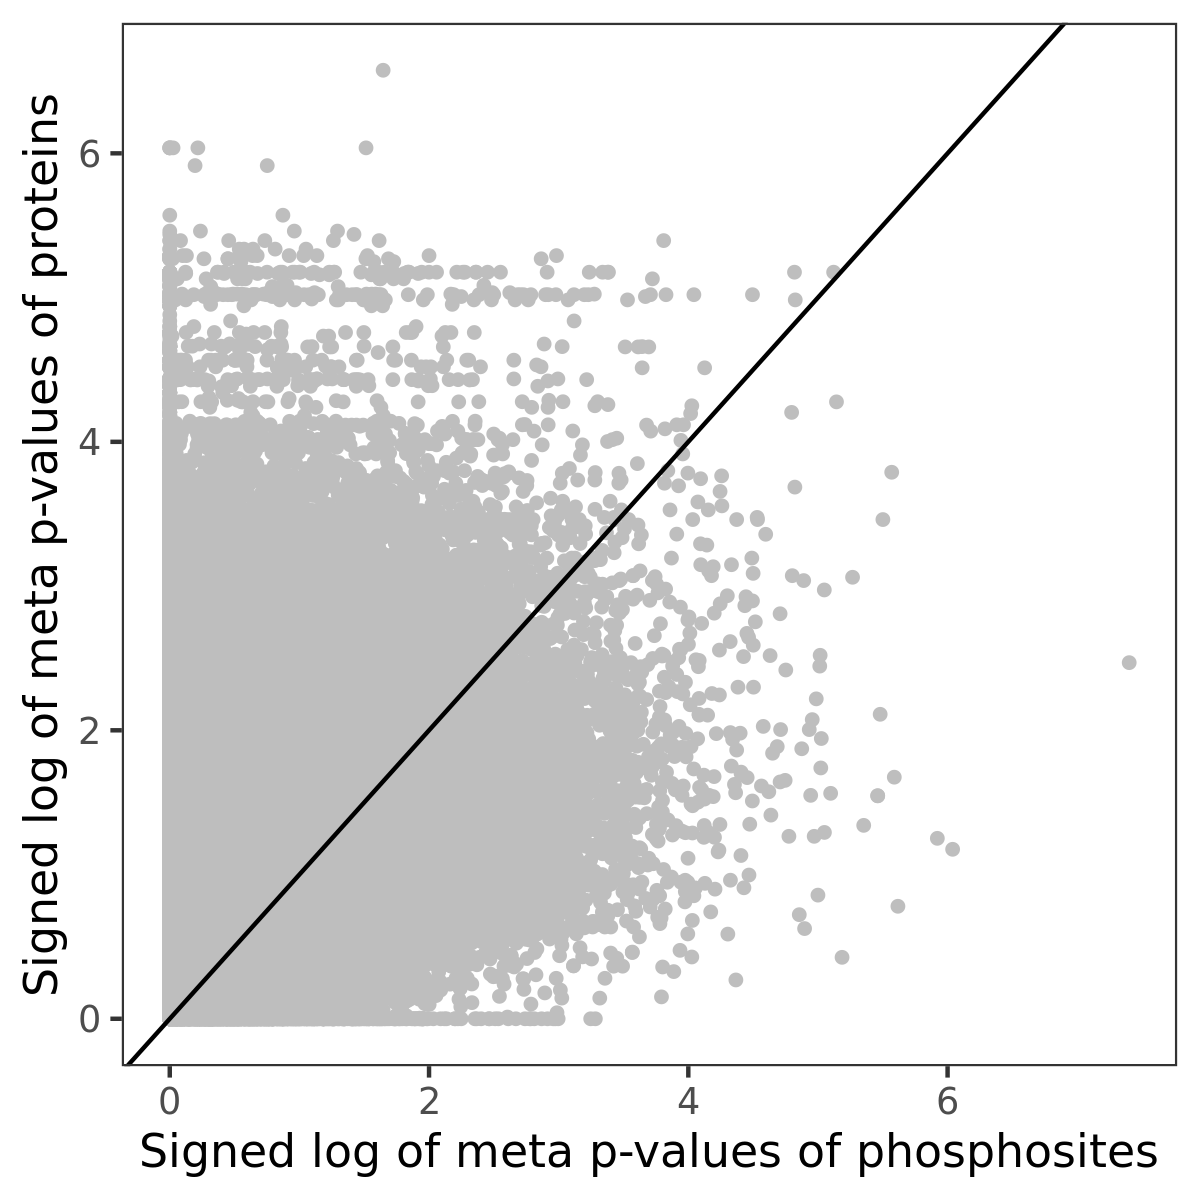
Number of significant genes with P-value ≤ 10-6 for each cohorts are summarized in the bar plot. The scatter plot highlights significant associations diven by phosphorylation rather than protein abundance.
Signed p-values | |||||||||||||
|---|---|---|---|---|---|---|---|---|---|---|---|---|---|
Gene | Protein | Site | Meta P | BRCA | CCRCC | COAD | GBM | HNSCC | LSCC | LUAD | OV | PDAC | UCEC |
| No matching records found | |||||||||||||
Gene set enrichment analysis
Submit phosphorylation sites and the common logarithm of the p-values of their association with Clinical: progression_free_survival to WebGestalt.