Tumor and normal comparison
Differential analyses were performed with Wilcoxon rank sum test.
Gene level comparison
Number of significant genes with P-value <= 10-6
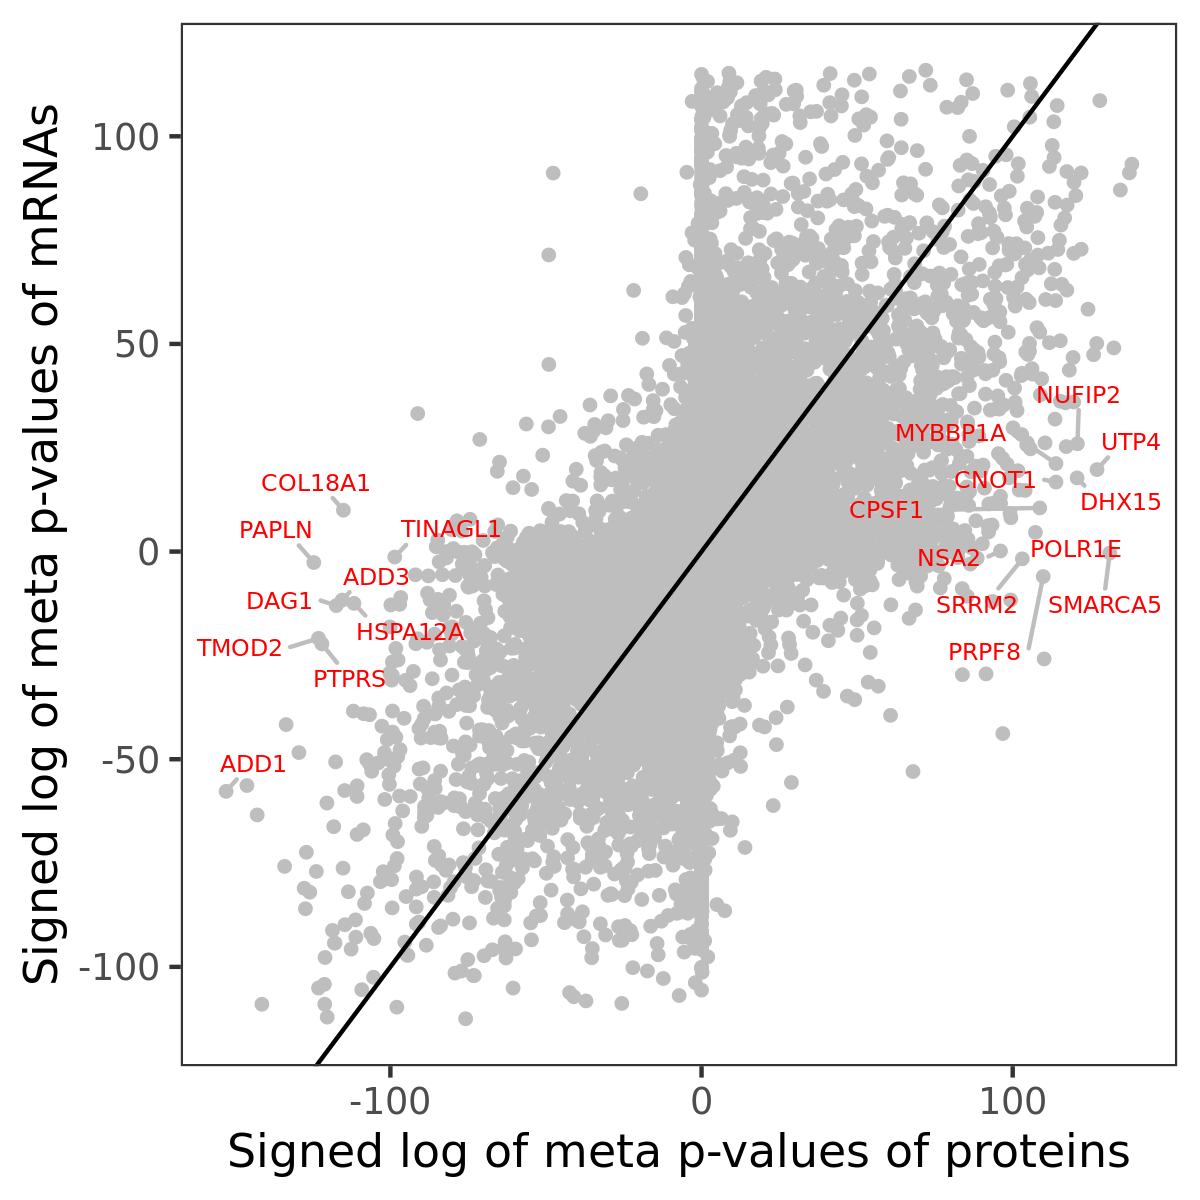
Association of protein abundance of genes
| Signed p-values | |||||||||||
|---|---|---|---|---|---|---|---|---|---|---|---|
| Gene | Meta P | BRCA | CCRCC | COAD | GBM | HNSCC | LSCC | LUAD | OV | PDAC | UCEC |
Gene set enrichment analysis
Submit genes and the common logarithm of the p-values of tumor and normal difference to WebGestalt.
Phosphosite level comparison
Number of significant phosphosites with P-value <= 10-6
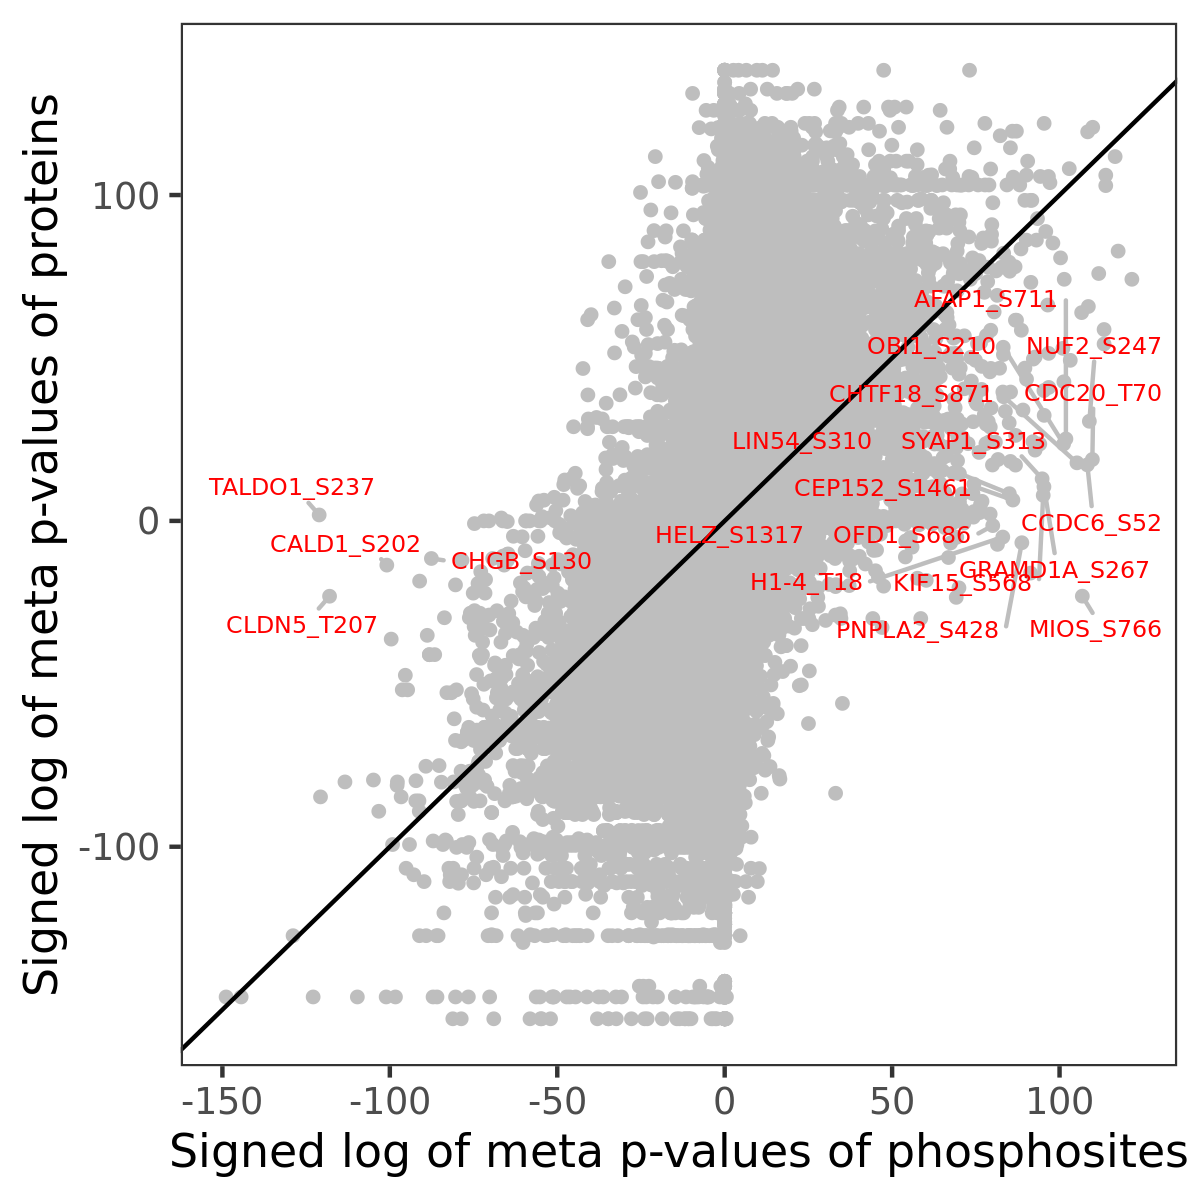
| Signed p-values | |||||||||||||
|---|---|---|---|---|---|---|---|---|---|---|---|---|---|
| Gene | Protein | Site | Meta P | BRCA | CCRCC | COAD | GBM | HNSCC | LSCC | LUAD | OV | PDAC | UCEC |
Gene set enrichment analysis
Submit phosphorylation sites and the common logarithm of the p-values of tumor and normal difference to WebGestalt.