Basic information
- Phenotype
- HALLMARK_PROTEIN_SECRETION
- Description
- Enrichment score representing genes involved in protein secretion. The score was calculated using ssGSEA on the RNA data (Z-score transformed coding genes with expression in at least 50% of the samples in a cohort).
- Source
- http://www.gsea-msigdb.org/gsea/msigdb/cards/HALLMARK_PROTEIN_SECRETION.html
- Method
- Single sample gene set enrichment analysis (ssGSEA) was performed for each cancer type using gene-wise Z-scores of the RNA expression data (RSEM) for the MSigDB Hallmark gene sets v7.0 (PMID: 26771021) via the ssGSEA2.0 R package (PMID: 30563849). RNA data were filtered to coding genes with < 50% 0 expression. (Parameters: sample.norm.type="rank", weight=0.75, statistic="area.under.RES", nperm=1000, min.overlap=10). Pathway activity scores are normalized enrichment scores from ssGSEA.
- Genes
-
- ADAM10
- ANP32E
- AP1G1
- AP2B1
- AP2M1
- AP2S1
- AP3B1
- AP3S1
- ARCN1
- ARF1
- ARFGAP3
- ARFGEF1
- ARFGEF2
- ARFIP1
- ATP1A1
- ATP6V1B1
- ATP6V1H
- ATP7A
- BET1
- BNIP3
- CAV2
- CD63
- CLCN3
- CLN5
- CLTA
- CLTC
- COG2
- COPB1
- COPB2
- COPE
- CTSC
- DNM1L
- DOP1A
- DST
- EGFR
- ERGIC3
- GALC
- GBF1
- GLA
- GNAS
- GOLGA4
- GOSR2
- ICA1
- IGF2R
- KIF1B
- KRT18
- LAMP2
- LMAN1
- M6PR
- MAPK1
- MON2
- NAPA
- NAPG
- OCRL
- PAM
- PPT1
- RAB14
- RAB22A
- RAB2A
- RAB5A
- RAB9A
- RER1
- RPS6KA3
- SCAMP1
- SCAMP3
- SCRN1
- SEC22B
- SEC24D
- SEC31A
- SGMS1
- SH3GL2
- SNAP23
- SNX2
- SOD1
- SSPN
- STAM
- STX12
- STX16
- STX7
- TMED10
- TMED2
- TMX1
- TOM1L1
- TPD52
- TSG101
- TSPAN8
- USO1
- VAMP3
- VAMP4
- VAMP7_PAR_Y
- VPS45
- VPS4B
- YIPF6
- YKT6
- ZW10
- More...
Gene association
Number of significant genes with P-value ≤ 10-6 for each cohorts are summarized in bar plots. The scatter plot highlights significant associations diven by protein rather than mRNA abundance.
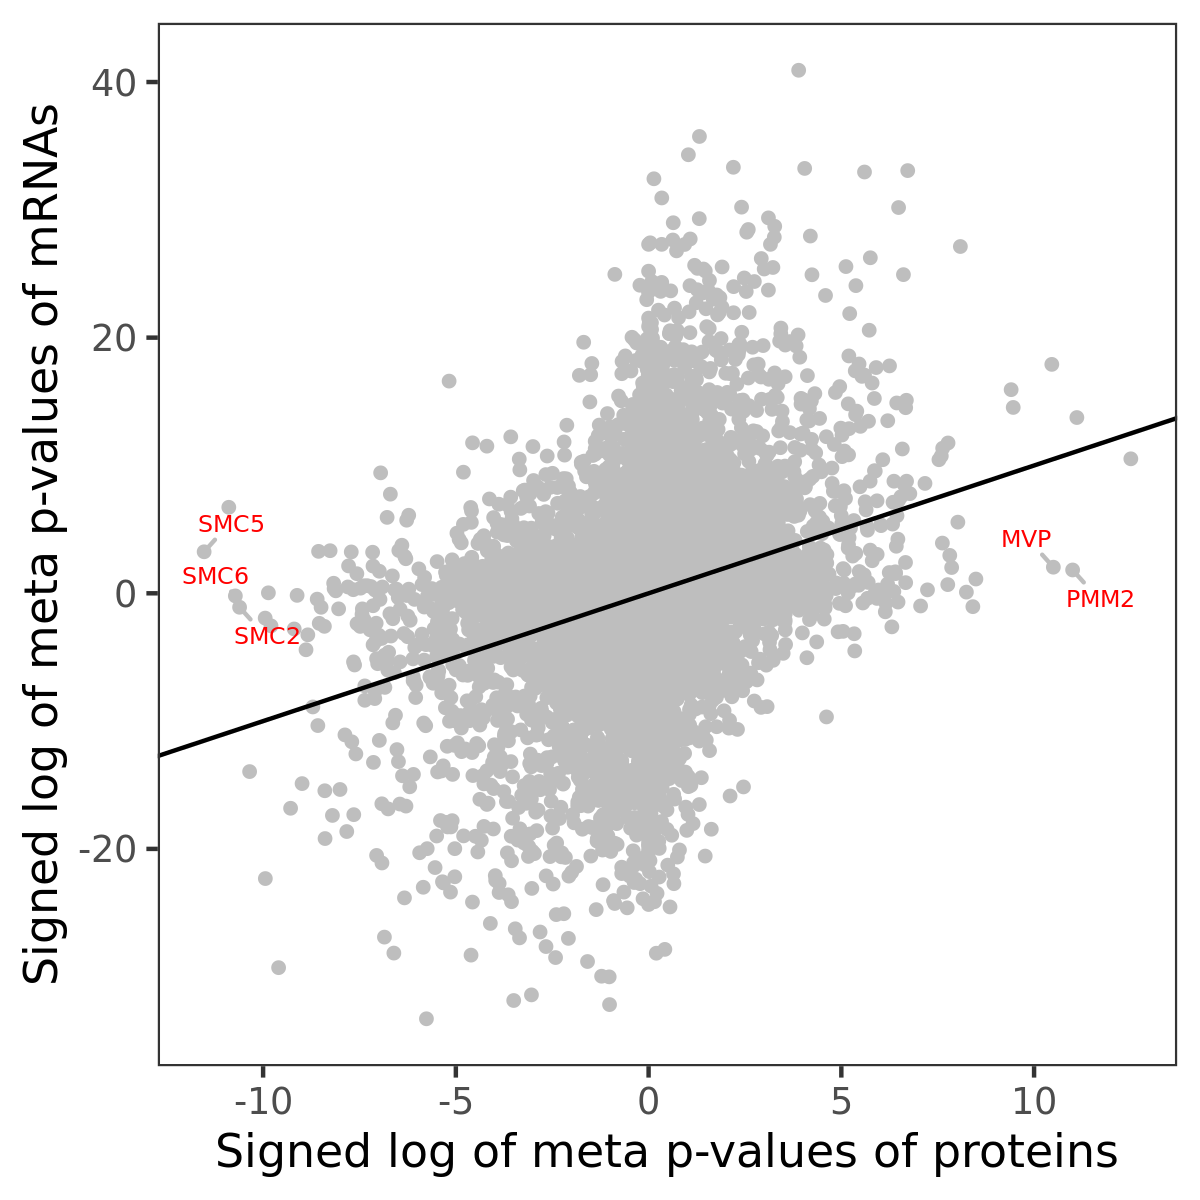
Association of protein abundance of genes
Signed p-values | ||||||||||||
|---|---|---|---|---|---|---|---|---|---|---|---|---|
Gene | Meta P | BRCA | CCRCC | COAD | GBM | HNSCC | LSCC | LUAD | OV | PDAC | UCEC | |
| No matching records found | ||||||||||||
Gene set enrichment analysis
Submit genes and the common logarithm of the p-values of their association with HALLMARK_PROTEIN_SECRETION to WebGestalt.
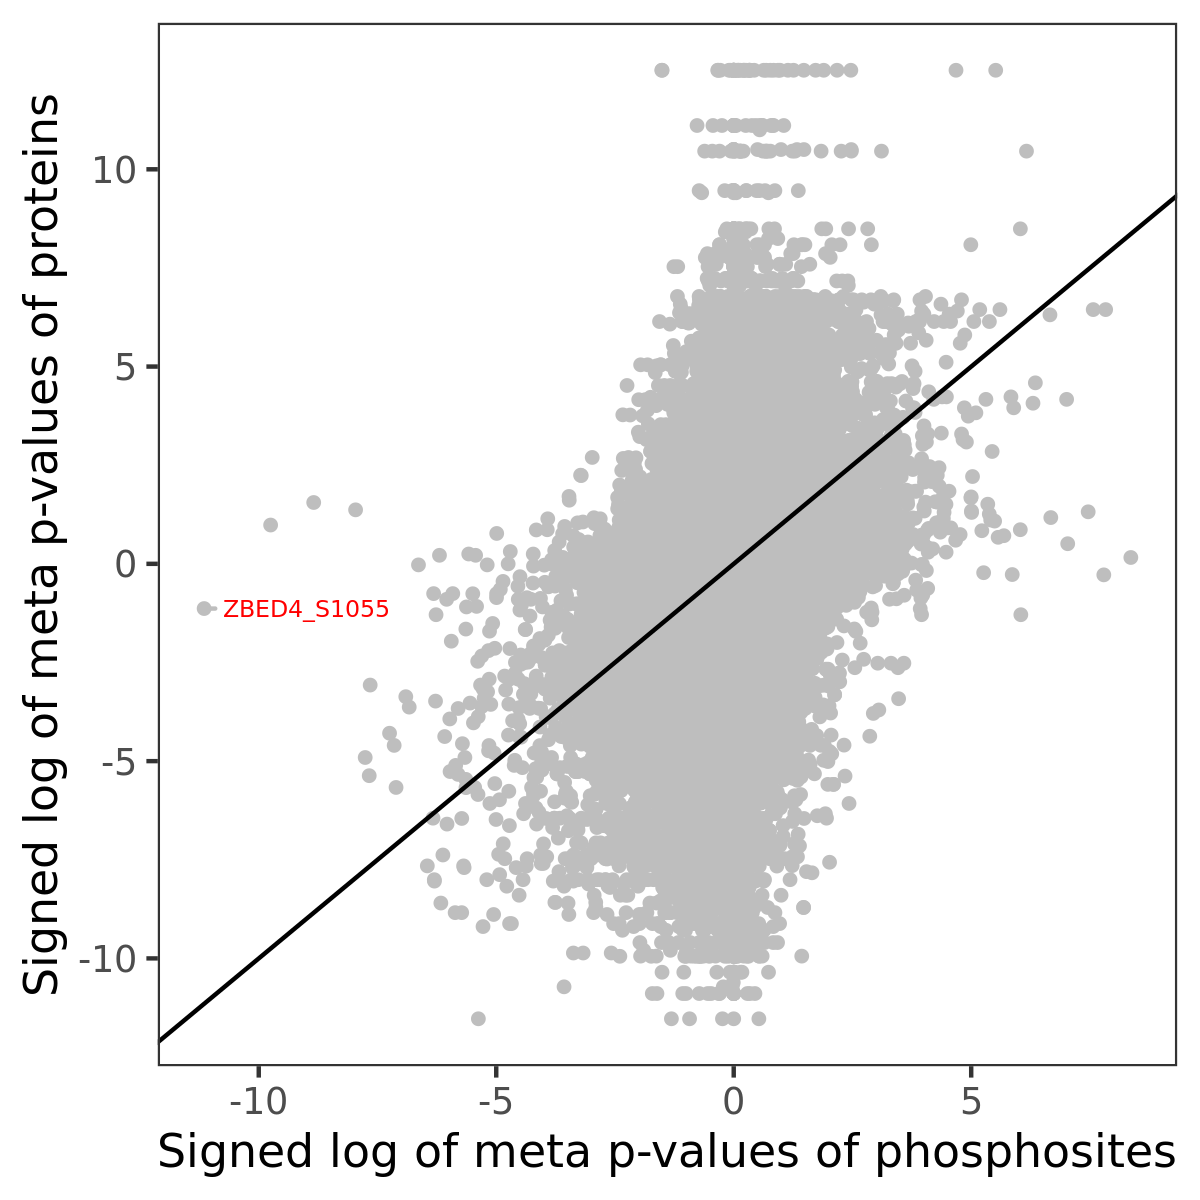
Phosphosite association
Number of significant genes with P-value ≤ 10-6 for each cohorts are summarized in the bar plot. The scatter plot highlights significant associations diven by phosphorylation rather than protein abundance.
Signed p-values | |||||||||||||
|---|---|---|---|---|---|---|---|---|---|---|---|---|---|
Gene | Protein | Site | Meta P | BRCA | CCRCC | COAD | GBM | HNSCC | LSCC | LUAD | OV | PDAC | UCEC |
| No matching records found | |||||||||||||
Gene set enrichment analysis
Submit phosphorylation sites and the common logarithm of the p-values of their association with HALLMARK_PROTEIN_SECRETION to WebGestalt.