Basic information
- Phenotype
- PROGENy: Hypoxia
- Description
- Score representing the activity of the pathway induced by hypoxia. It was calculated using the PROGENy tool on the RNA data (genes with mean FPKM expression >0).
- Source
- https://www.nature.com/articles/s41467-017-02391-6; https://www.sciencedirect.com/science/article/abs/pii/S1874939919302287?via%3Dihub
- Method
- The PROGENy scores were inferred using the R package progeny (V1.10.0) (PMID: 29295995) with default parameters using the RNA expression data (FPKM). Genes with mean expression = 0 in a cohort were removed from the analysis.
- Genes
-
- AK4
- ALDOA
- ALDOC
- ANGPTL4
- ANKRD37
- ANKZF1
- BCKDK
- BHLHE40
- BNIP3
- BNIP3L
- C4orf3
- C4orf47
- C8orf58
- CA9
- CCNG2
- CLK3
- CRKL
- DOLK
- EFNA3
- EGLN1
- EGLN3
- ENO1
- ENO2
- ERO1A
- FAM13A
- FAM162A
- FBXO42
- FLAD1
- FUT11
- GAPDH
- GBE1
- GPI
- GYS1
- HILPDA
- INSIG2
- KDM3A
- KDM4B
- KDM4C
- LDHA
- LOX
- LOXL2
- MAPK7
- MPI
- MXI1
- NARF
- NCKIPSD
- NDRG1
- NGLY1
- Array
- NOL3
- NRN1
- P4HA1
- P4HA2
- P4HA2
- PAM
- PDK1
- PDK3
- PFKFB3
- PFKFB4
- PFKL
- PFKP
- PGAM1
- PGK1
- PGM1
- PKM
- PLOD1
- PLOD2
- POP4
- PPFIA4
- PPP2R5B
- PRSS53
- QRSL1
- RAB20
- RBPJ
- RIOK3
- RLF
- RNF24
- RORA
- SAP30
- SEC61G
- SLC25A36
- SLC2A1
- SPAG4
- TMEM45A
- TMX2
- VEGFA
- VKORC1
- VLDLR
- WDR45B
- WDR54
- WSB1
- YEATS2
- ZBTB25
- ZMPSTE24
- ZNF160
- ZNF292
- ZNF395
- ZNF654
- More...
Gene association
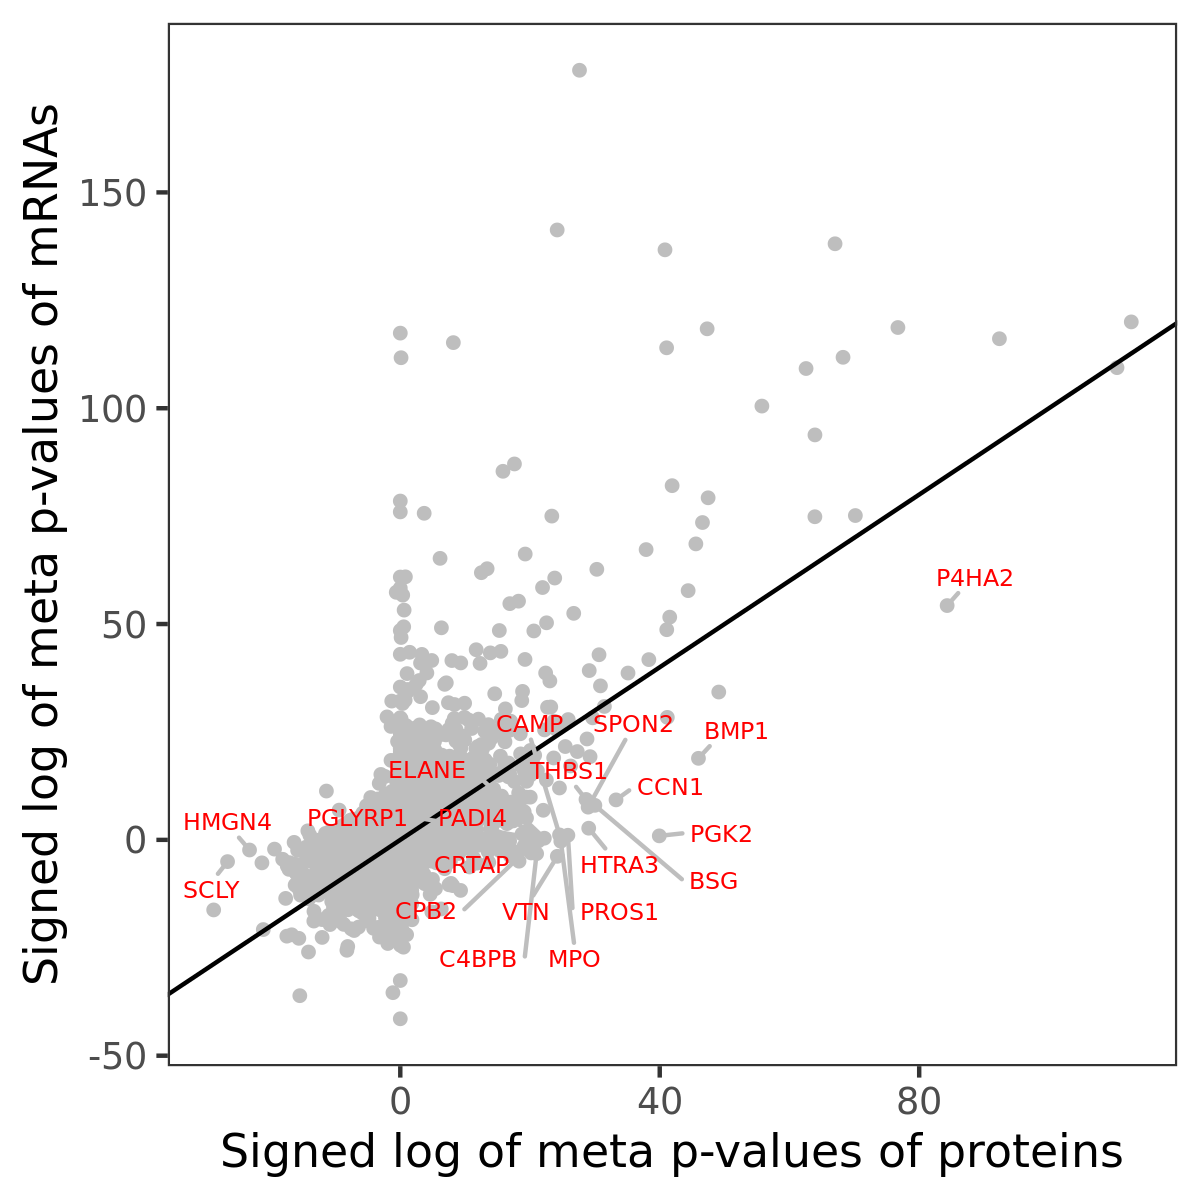
Number of significant genes with P-value ≤ 10-6 for each cohorts are summarized in bar plots. The scatter plot highlights significant associations diven by protein rather than mRNA abundance.
Association of protein abundance of genes
Signed p-values | ||||||||||||
|---|---|---|---|---|---|---|---|---|---|---|---|---|
Gene | Meta P | BRCA | CCRCC | COAD | GBM | HNSCC | LSCC | LUAD | OV | PDAC | UCEC | |
| No matching records found | ||||||||||||
Gene set enrichment analysis
Submit genes and the common logarithm of the p-values of their association with PROGENy: Hypoxia to WebGestalt.
Phosphosite association
Number of significant genes with P-value ≤ 10-6 for each cohorts are summarized in the bar plot. The scatter plot highlights significant associations diven by phosphorylation rather than protein abundance.

Signed p-values | |||||||||||||
|---|---|---|---|---|---|---|---|---|---|---|---|---|---|
Gene | Protein | Site | Meta P | BRCA | CCRCC | COAD | GBM | HNSCC | LSCC | LUAD | OV | PDAC | UCEC |
| No matching records found | |||||||||||||
Gene set enrichment analysis
Submit phosphorylation sites and the common logarithm of the p-values of their association with PROGENy: Hypoxia to WebGestalt.