Basic information
- Phenotype
- PROGENy: JAK-STAT
- Description
- Score representing the activity of the JAK-STAT pathway. It was calculated using the PROGENy tool on the RNA data (genes with mean FPKM expression >0).
- Source
- https://www.nature.com/articles/s41467-017-02391-6; https://www.sciencedirect.com/science/article/abs/pii/S1874939919302287?via%3Dihub
- Method
- The PROGENy scores were inferred using the R package progeny (V1.10.0) (PMID: 29295995) with default parameters using the RNA expression data (FPKM). Genes with mean expression = 0 in a cohort were removed from the analysis.
- Genes
-
- APOBEC3G
- APOL1
- APOL2
- APOL3
- APOL4
- APOL6
- BATF2
- BST2
- CASP4
- CMPK2
- CMTR1
- CNP
- CXCL11
- CYP2J2
- DDX58
- DDX60
- DDX60L
- DHX58
- DTX3L
- EIF2AK2
- EPSTI1
- ETV7
- GBP1
- GBP4
- HELZ2
- HERC5
- HERC6
- IFI16
- IFI27
- IFI35
- IFI44
- IFI44L
- IFI6
- Array
- IFIH1
- IFIT1
- IFIT2
- IFIT3
- IFIT5
- IFITM1
- IRF7
- IRF9
- ISG15
- LAMP3
- LAP3
- MX1
- MX2
- MYD88
- NLRC5
- NMI
- OAS1
- OAS2
- OAS3
- OASL
- OGFR
- PARP12
- PARP14
- PARP9
- PHF11
- PLSCR1
- PLSCR2
- PML
- PRKD2
- PSMB8
- PSMB9
- RNF114
- RNF213
- RSAD2
- RTP4
- SAMD9
- SAMD9L
- SAMHD1
- SECTM1
- SLC15A3
- SLC25A28
- SP100
- SP110
- SP140L
- STAT1
- STAT2
- TAP1
- TAP2
- TDRD7
- TMEM140
- TMEM62
- TRANK1
- TRIM14
- TRIM21
- TRIM22
- TRIM25
- TRIM38
- TRIM5
- UBE2L6
- USP18
- XAF1
- ZBP1
- ZC3HAV1
- ZNFX1
- More...
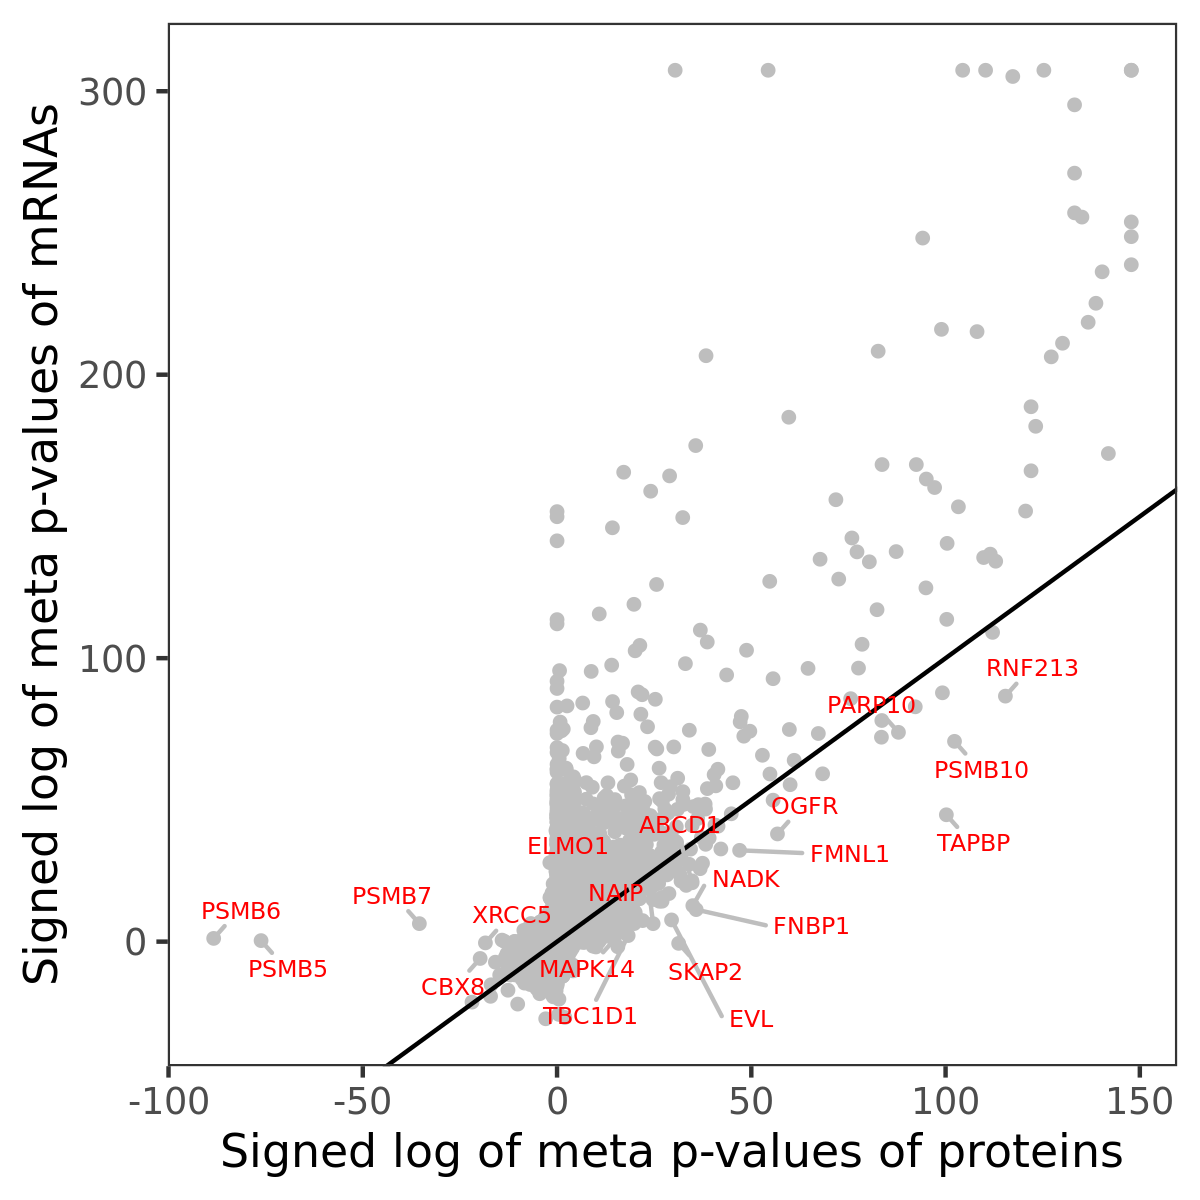
Gene association
Number of significant genes with P-value ≤ 10-6 for each cohorts are summarized in bar plots. The scatter plot highlights significant associations diven by protein rather than mRNA abundance.
Association of protein abundance of genes
Signed p-values | ||||||||||||
|---|---|---|---|---|---|---|---|---|---|---|---|---|
Gene | Meta P | BRCA | CCRCC | COAD | GBM | HNSCC | LSCC | LUAD | OV | PDAC | UCEC | |
| No matching records found | ||||||||||||
Gene set enrichment analysis
Submit genes and the common logarithm of the p-values of their association with PROGENy: JAK-STAT to WebGestalt.
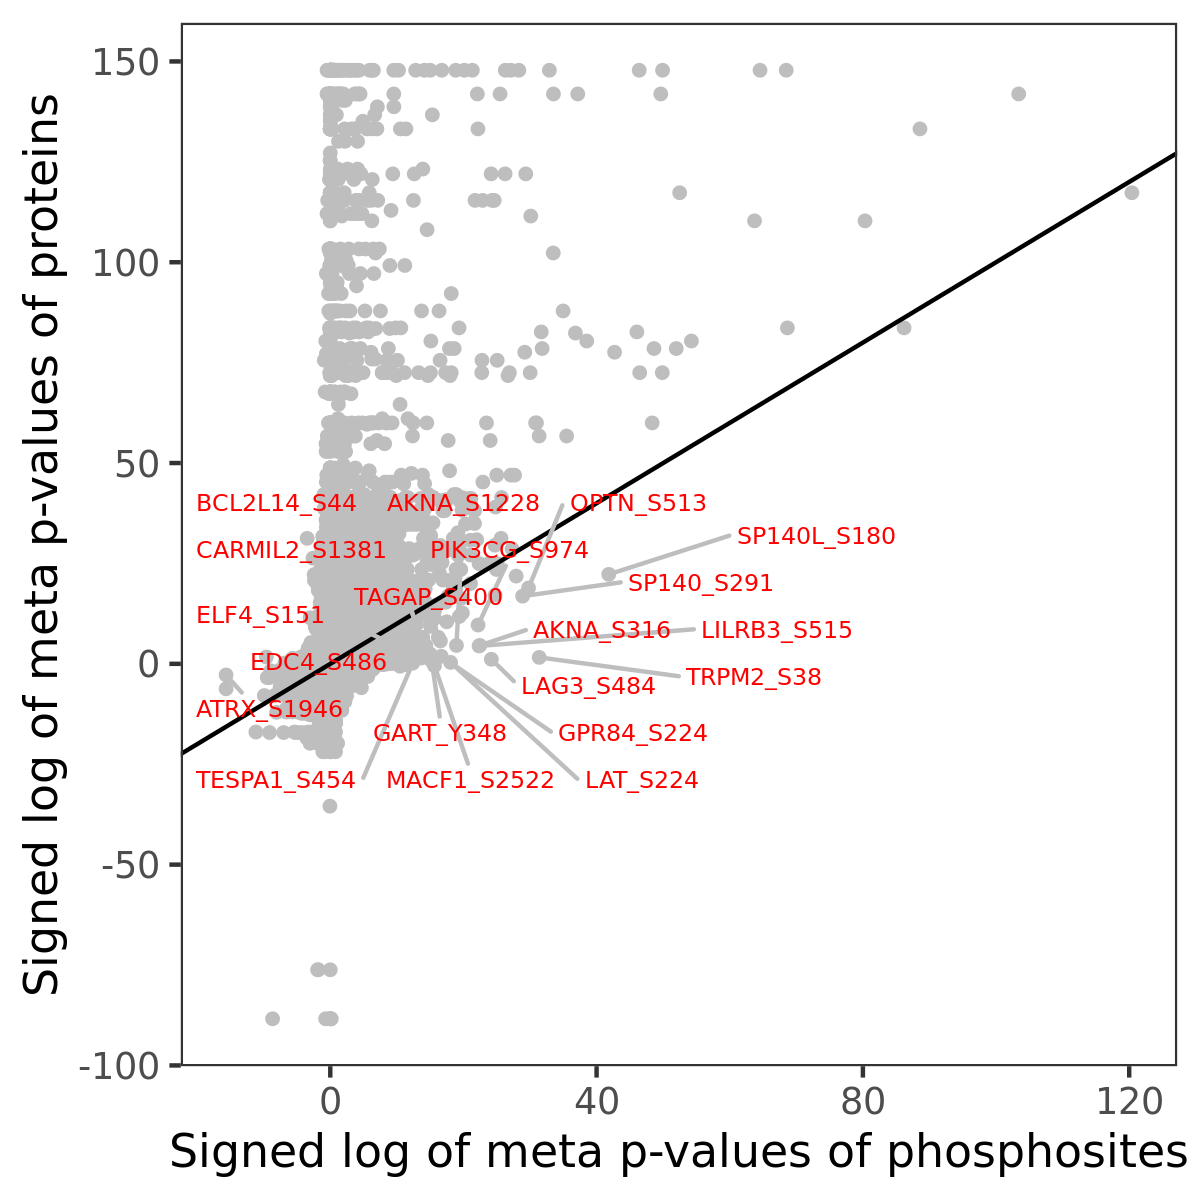
Phosphosite association
Number of significant genes with P-value ≤ 10-6 for each cohorts are summarized in the bar plot. The scatter plot highlights significant associations diven by phosphorylation rather than protein abundance.
Signed p-values | |||||||||||||
|---|---|---|---|---|---|---|---|---|---|---|---|---|---|
Gene | Protein | Site | Meta P | BRCA | CCRCC | COAD | GBM | HNSCC | LSCC | LUAD | OV | PDAC | UCEC |
| No matching records found | |||||||||||||
Gene set enrichment analysis
Submit phosphorylation sites and the common logarithm of the p-values of their association with PROGENy: JAK-STAT to WebGestalt.