Basic information
- Phenotype
- PROGENy: VEGF
- Description
- Score representing the activity of the VEGF-activated pathway. It was calculated using the PROGENy tool on the RNA data (genes with mean FPKM expression >0).
- Source
- https://www.nature.com/articles/s41467-017-02391-6; https://www.sciencedirect.com/science/article/abs/pii/S1874939919302287?via%3Dihub
- Method
- The PROGENy scores were inferred using the R package progeny (V1.10.0) (PMID: 29295995) with default parameters using the RNA expression data (FPKM). Genes with mean expression = 0 in a cohort were removed from the analysis.
- Genes
-
- Array
- NCKAP5
- NID2
- NKD2
- NLGN1
- NRG3
- NUDT19
- Array
- P2RY14
- PHACTR3
- PIEZO2
- RORB
- SCML4
- SENP5
- SMAD1
- SMCO3
- Array
- PKHD1L1
- PTCH1
- PTCH1
- RGL1
- Array
- MYO3A
- SPAG6
- SPINK2
- Array
- SRGAP2
- TMCC3
- TTC28
- UNC5D
- VASH2
- VPREB1
- VPREB3
- VWA8
- Array
- WNT16
- XK
- XKR4
- ZNF200
- ZNF257
- ZNF347
- ZNF415
- ZNF597
- ZNF669
- Array
- ADGRD1
- AHRR
- AHRR_ENSG00000063438
- ALDH1A1
- ANKS1B
- ART4
- BCAR3
- BEND4
- C1QTNF4
- CAMK4
- Array
- CCDC81
- Array
- CCM2
- CD72
- CD93
- CDC37L1
- CNR1
- CPA6
- CRYM
- CYTL1
- DCHS2
- EPHA3
- EPN2
- Array
- Array
- Array
- LRMP
- Array
- Array
- Array
- Array
- Array
- LMO2
- Array
- GP5
- HACD4
- HMHB1
- HTR1F
- IGLL1
- IKZF3
- IMMP2L
- JCHAIN
- Array
- KCNK10
- More...
Gene association
Number of significant genes with P-value ≤ 10-6 for each cohorts are summarized in bar plots. The scatter plot highlights significant associations diven by protein rather than mRNA abundance.
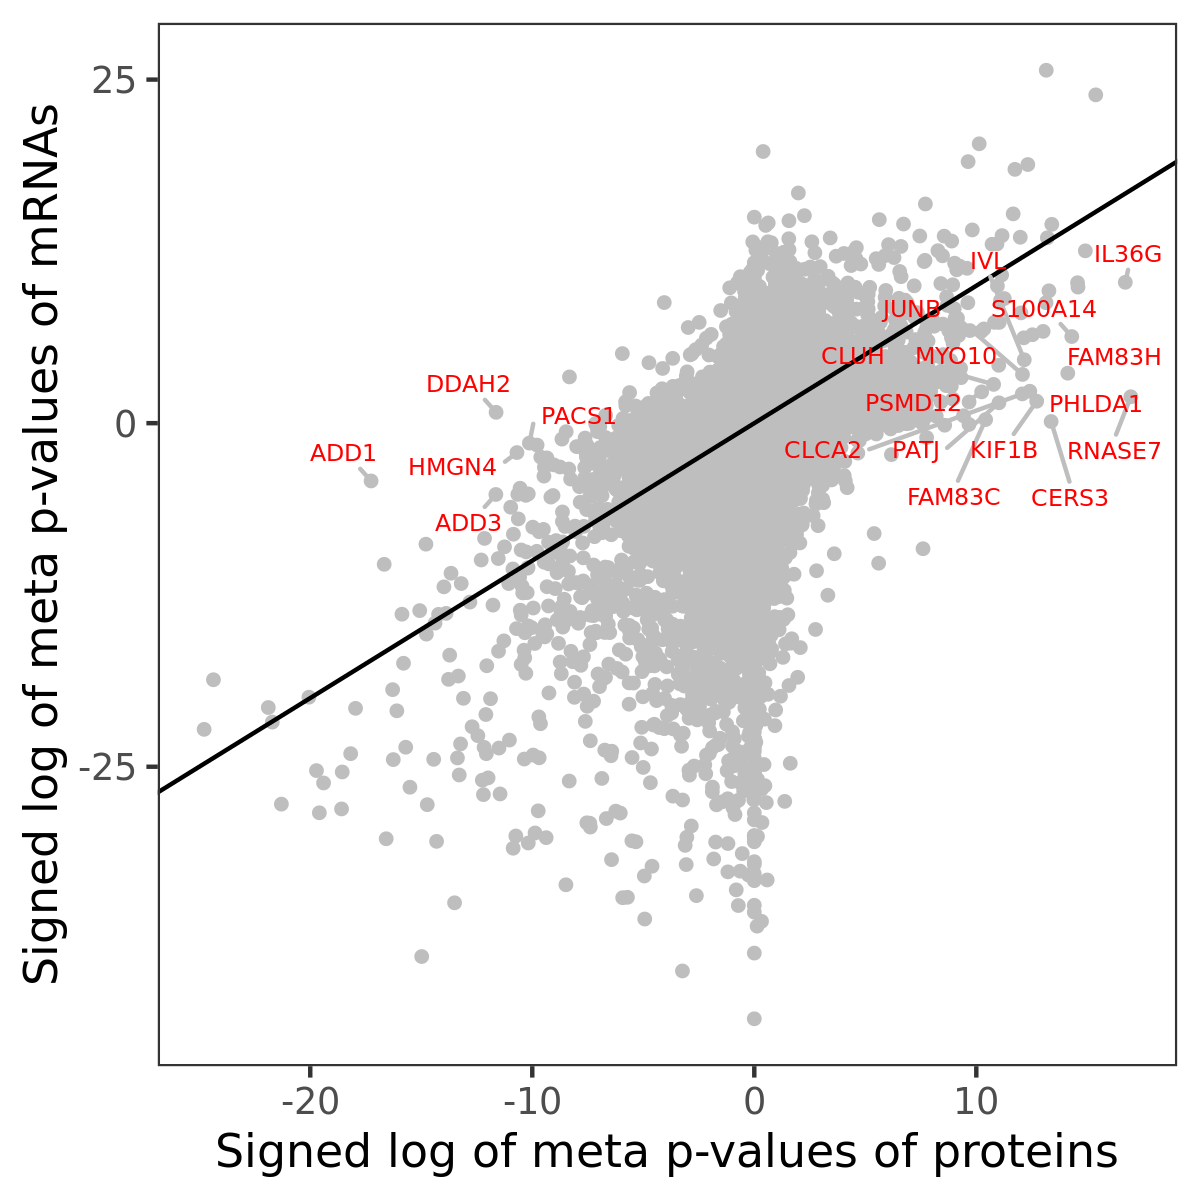
Association of protein abundance of genes
| Signed p-values | |||||||||||
|---|---|---|---|---|---|---|---|---|---|---|---|
| Gene | Meta P | BRCA | CCRCC | COAD | GBM | HNSCC | LSCC | LUAD | OV | PDAC | UCEC |
Gene set enrichment analysis
Submit genes and the common logarithm of the p-values of their association with PROGENy: VEGF to WebGestalt.
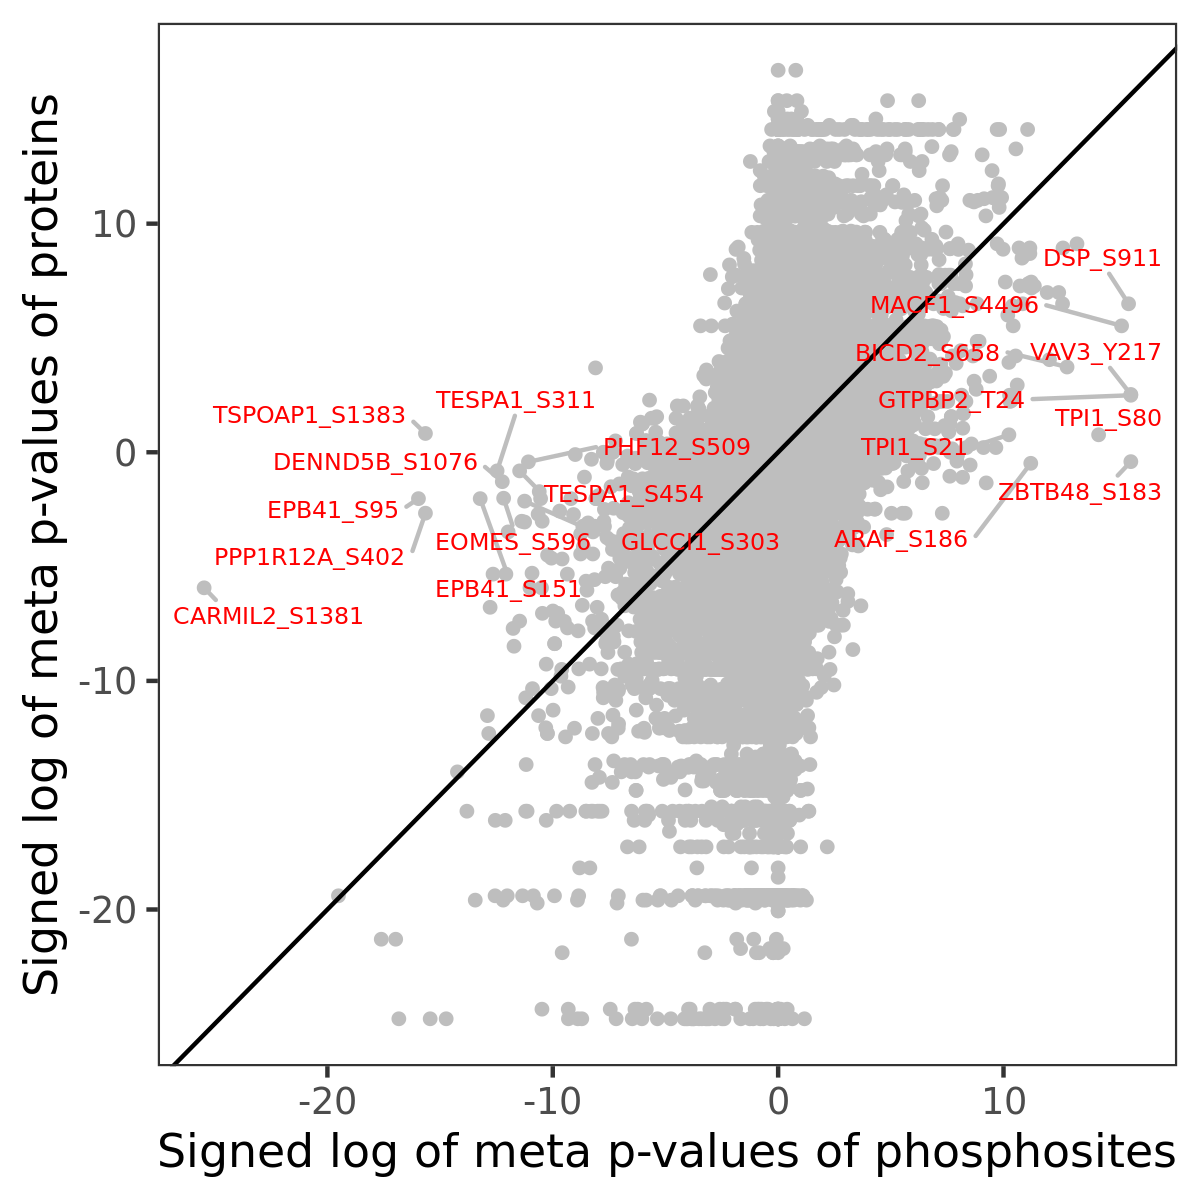
Phosphosite association
Number of significant genes with P-value ≤ 10-6 for each cohorts are summarized in the bar plot. The scatter plot highlights significant associations diven by phosphorylation rather than protein abundance.
| Signed p-values | |||||||||||||
|---|---|---|---|---|---|---|---|---|---|---|---|---|---|
| Gene | Protein | Site | Meta P | BRCA | CCRCC | COAD | GBM | HNSCC | LSCC | LUAD | OV | PDAC | UCEC |
Gene set enrichment analysis
Submit phosphorylation sites and the common logarithm of the p-values of their association with PROGENy: VEGF to WebGestalt.