Basic information
- Phenotype
- xcell: T cell CD8+ naive
- Description
- Enrichment score inferring the proportion of naïve CD8+ T cells in the tumor derived from RNA data using the xCell tool.
- Source
- https://genomebiology.biomedcentral.com/articles/10.1186/s13059-017-1349-1
- Method
- The R package immunedeconv (V2.0.4) (PMID: 31510660) was used to perform immune cell deconvolution using RNA expression data (TPM).
- Genes
-
- BCAS2
- BTNL8
- BUD31
- C19orf53
- CA14
- CCDC87
- CCR8
- CD8A
- CD8B
- CDK5RAP1
- CGRRF1
- CILP
- COX4I1
- CWF19L1
- DDX24
- EEF1D
- FXYD7
- GDAP2
- GJB4
- GPR15
- GPR52
- HAUS3
- HIGD2A
- HTR1B
- IL21R
- JMJD6
- JOSD1
- KIAA1109
- KRT1
- LIN28A
- LUZP4
- MED31
- MOGAT2
- MS4A5
- MYL1
- NDUFA1
- NDUFA4
- NDUFS5
- NGDN
- NKTR
- OMG
- PCIF1
- PSG11
- RFX2
- RNF7
- RNMT
- RPP38
- RRH
- RRP8
- SETD2
- SKI
- SLC17A4
- SLC35E1
- SMCP
- SMR3B
- SON
- SS18L2
- TNKS2
- TPP2
- USP36
- ZNHIT3
- More...
Gene association
Number of significant genes with P-value ≤ 10-6 for each cohorts are summarized in bar plots. The scatter plot highlights significant associations diven by protein rather than mRNA abundance.
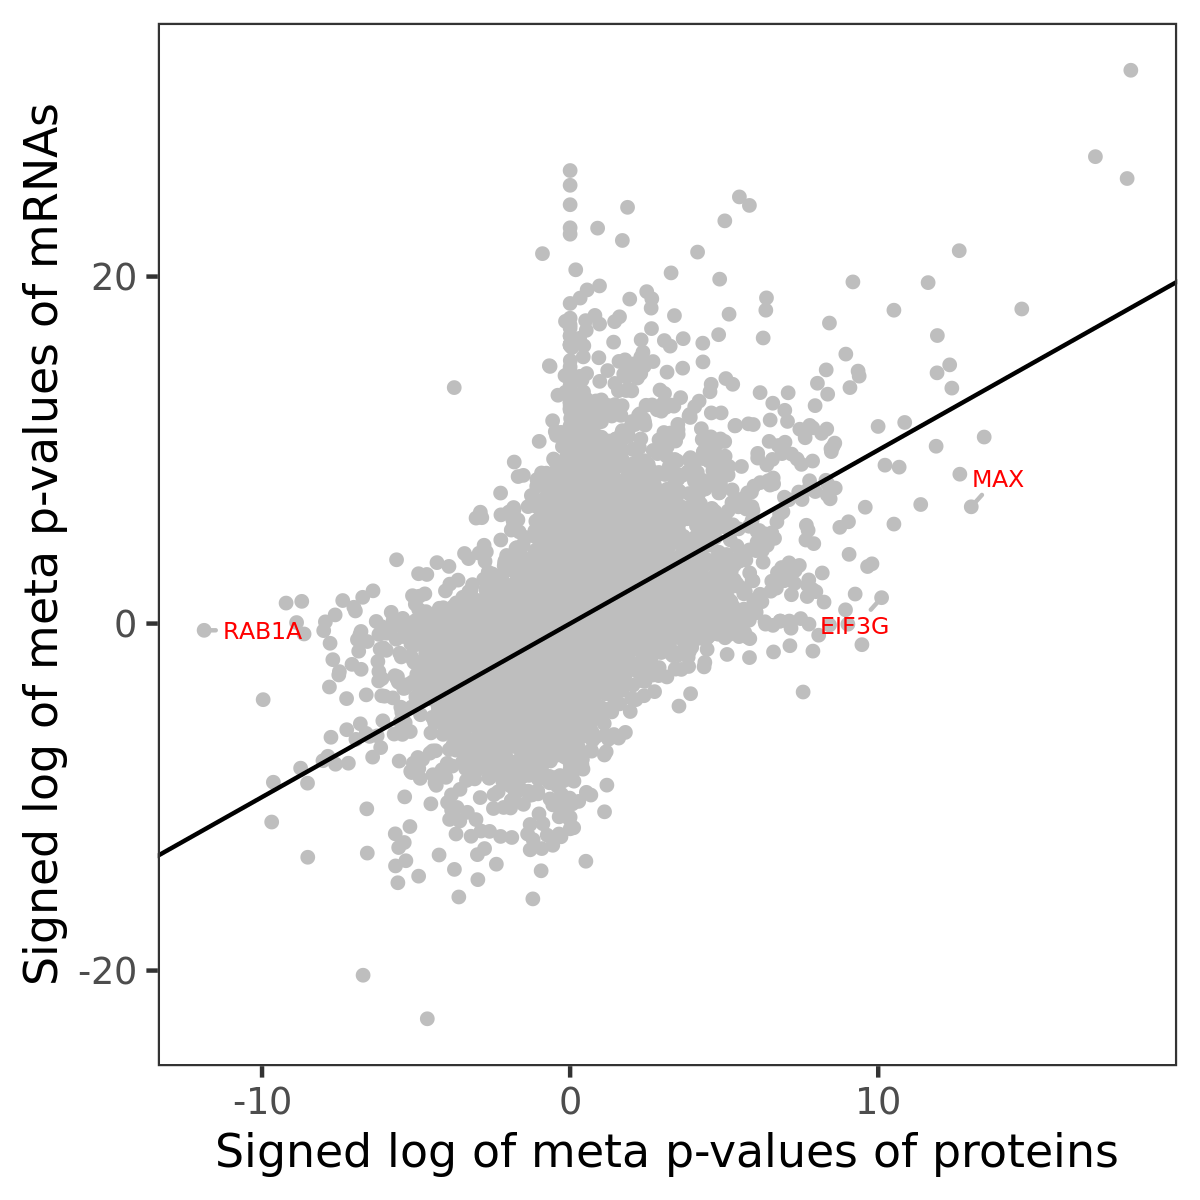
Association of protein abundance of genes
Signed p-values | ||||||||||||
|---|---|---|---|---|---|---|---|---|---|---|---|---|
Gene | Meta P | BRCA | CCRCC | COAD | GBM | HNSCC | LSCC | LUAD | OV | PDAC | UCEC | |
| No matching records found | ||||||||||||
Gene set enrichment analysis
Submit genes and the common logarithm of the p-values of their association with xcell: T cell CD8+ naive to WebGestalt.
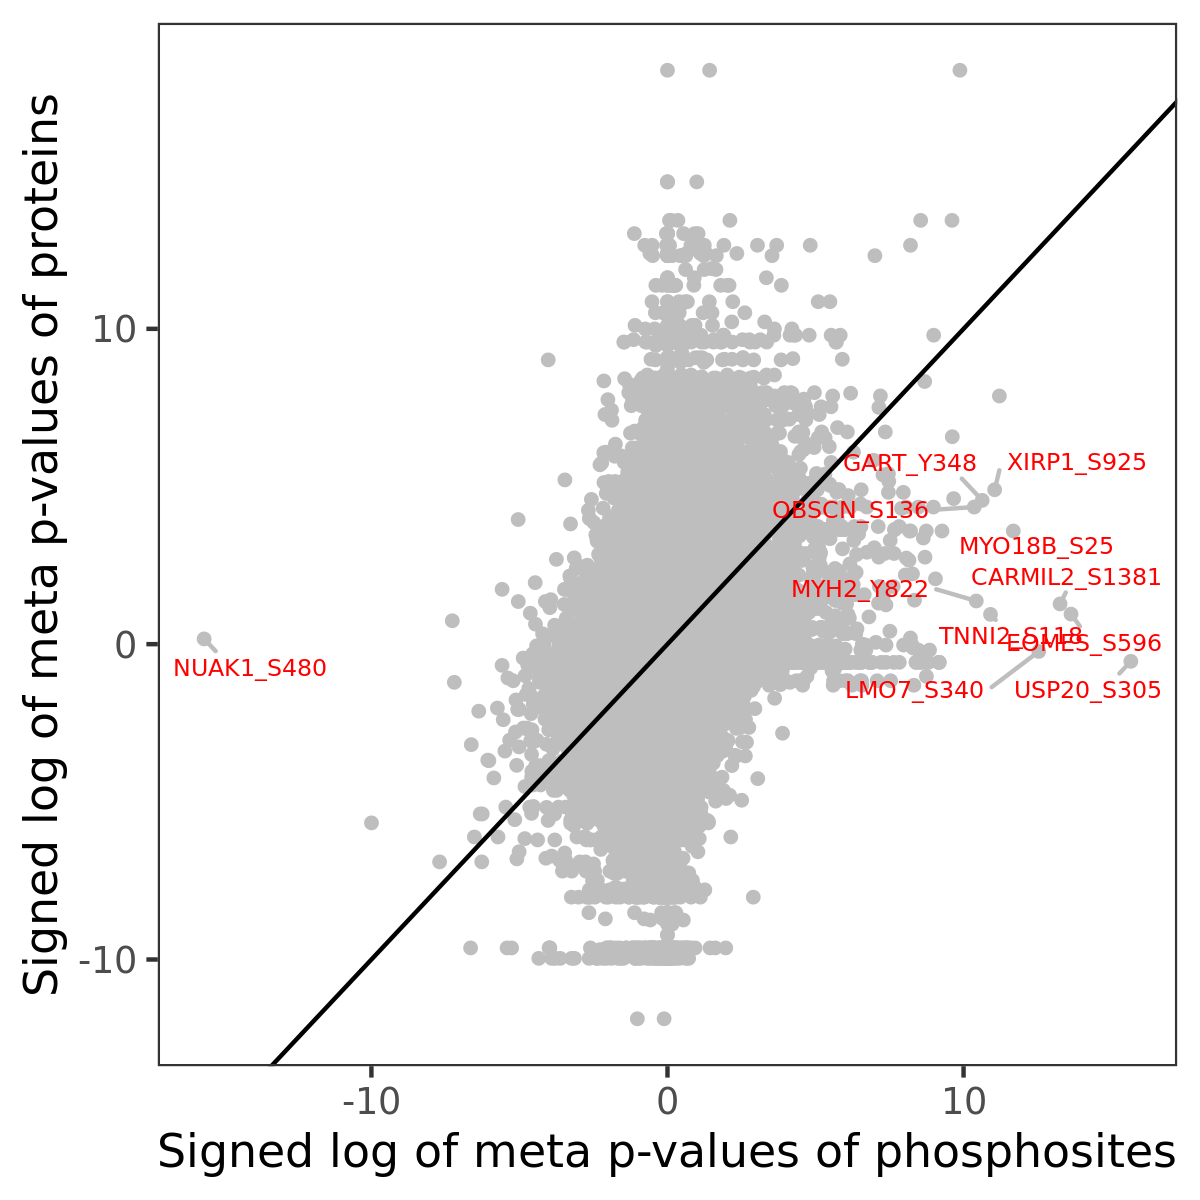
Phosphosite association
Number of significant genes with P-value ≤ 10-6 for each cohorts are summarized in the bar plot. The scatter plot highlights significant associations diven by phosphorylation rather than protein abundance.
Signed p-values | |||||||||||||
|---|---|---|---|---|---|---|---|---|---|---|---|---|---|
Gene | Protein | Site | Meta P | BRCA | CCRCC | COAD | GBM | HNSCC | LSCC | LUAD | OV | PDAC | UCEC |
| No matching records found | |||||||||||||
Gene set enrichment analysis
Submit phosphorylation sites and the common logarithm of the p-values of their association with xcell: T cell CD8+ naive to WebGestalt.