Basic information
- Phenotype
- xcell: T cell gamma delta
- Description
- Enrichment score inferring the proportion of gamma-delta T cells in the tumor derived from RNA data using the xCell tool.
- Source
- https://genomebiology.biomedcentral.com/articles/10.1186/s13059-017-1349-1
- Method
- The R package immunedeconv (V2.0.4) (PMID: 31510660) was used to perform immune cell deconvolution using RNA expression data (TPM).
- Genes
-
- ACD
- ACTR8
- AGGF1
- AK2
- AMZ2
- ARMC1
- ARPC2
- ARPC5L
- ARPP19
- ASCC1
- ASXL2
- ATG5
- ATP8B4
- AURKA
- BARD1
- BUB1
- CCL1
- CCNA2
- CCNF
- CCR2
- CCR3
- CCR5
- CD101
- CD2
- CD244
- CD247
- CD300A
- CD40LG
- CD96
- CDC123
- CDC25C
- CDC5L
- CDK1
- CENPA
- CENPJ
- CENPN
- CEP55
- CHEK1
- CHMP4A
- CHST12
- CIAO1
- CLIC1
- CLPP
- COLQ
- COMMD8
- COX8A
- CSNK1G1
- CSTF1
- CTLA4
- CXCR3
- CXCR6
- DAXX
- DBF4
- DBR1
- DCAF7
- DCLRE1A
- DLGAP5
- DR1
- DRG2
- ECT2
- FAF1
- FAM120A
- FASLG
- FZR1
- G3BP2
- GLE1
- GLMN
- GLO1
- GMEB1
- GMIP
- GNLY
- GPI
- GPKOW
- GPR15
- GPR171
- GPR68
- GRAP2
- GYG1
- GZMA
- GZMB
- GZMH
- GZMK
- HAT1
- HIC1
- HIVEP3
- HJURP
- HMGN4
- HMOX2
- HNRNPF
- HNRNPUL1
- HSPB11
- IFNG
- IKZF4
- IL12RB1
- IL13
- IL18RAP
- IL26
- IL2RA
- IL2RB
- IL4
- IL5
- INPP4A
- ITGAL
- ITGB7
- KIF11
- KIF14
- KIF22
- KIF2A
- KIF2C
- KLHL7
- KLRG1
- LAG3
- LAIR2
- LCP2
- LIM2
- LTA
- MELK
- MFSD5
- MKI67
- MMP25
- MNAT1
- MRPS15
- MSH3
- MTDH
- NCAPD3
- NCDN
- NCR3
- NEK2
- NFKBIB
- NKG7
- NMT1
- NUSAP1
- PBK
- PDE4A
- PDE6D
- PEX2
- PFN1
- PIAS4
- PLK4
- POP4
- PPID
- PPP1CA
- PRF1
- PSMA1
- PSMA3
- PSMB2
- PSMC4
- PSMD13
- PSMD14
- PSMD4
- PSMD7
- PSTPIP1
- PTP4A2
- PTPN4
- PTPN7
- PTPN9
- PUF60
- PVRIG
- RACGAP1
- RAD21
- RAD50
- RALY
- RANBP3
- RB1
- RBL1
- RC3H2
- RGS9
- RNF167
- RNF6
- RPA1
- RRM1
- RRM2
- SAC3D1
- SASH3
- SCAMP2
- SF3B4
- SFXN1
- SH2D1A
- SHMT2
- SLAMF1
- SLC25A32
- SLC26A4
- SMC2
- SOS1
- SPC25
- SRF
- STIP1
- STX8
- TAB2
- TACC3
- TAF1B
- TBX21
- TDP1
- TINF2
- TIPRL
- TMPO
- TOP3B
- TOR1A
- TOR1AIP1
- TPX2
- TTK
- UCHL5
- UEVLD
- USP1
- VANGL1
- WBP11
- ZBTB16
- ZBTB32
- ZCCHC4
- ZMAT5
- ZNF174
- ZNF668
- More...
Gene association
Number of significant genes with P-value ≤ 10-6 for each cohorts are summarized in bar plots. The scatter plot highlights significant associations diven by protein rather than mRNA abundance.
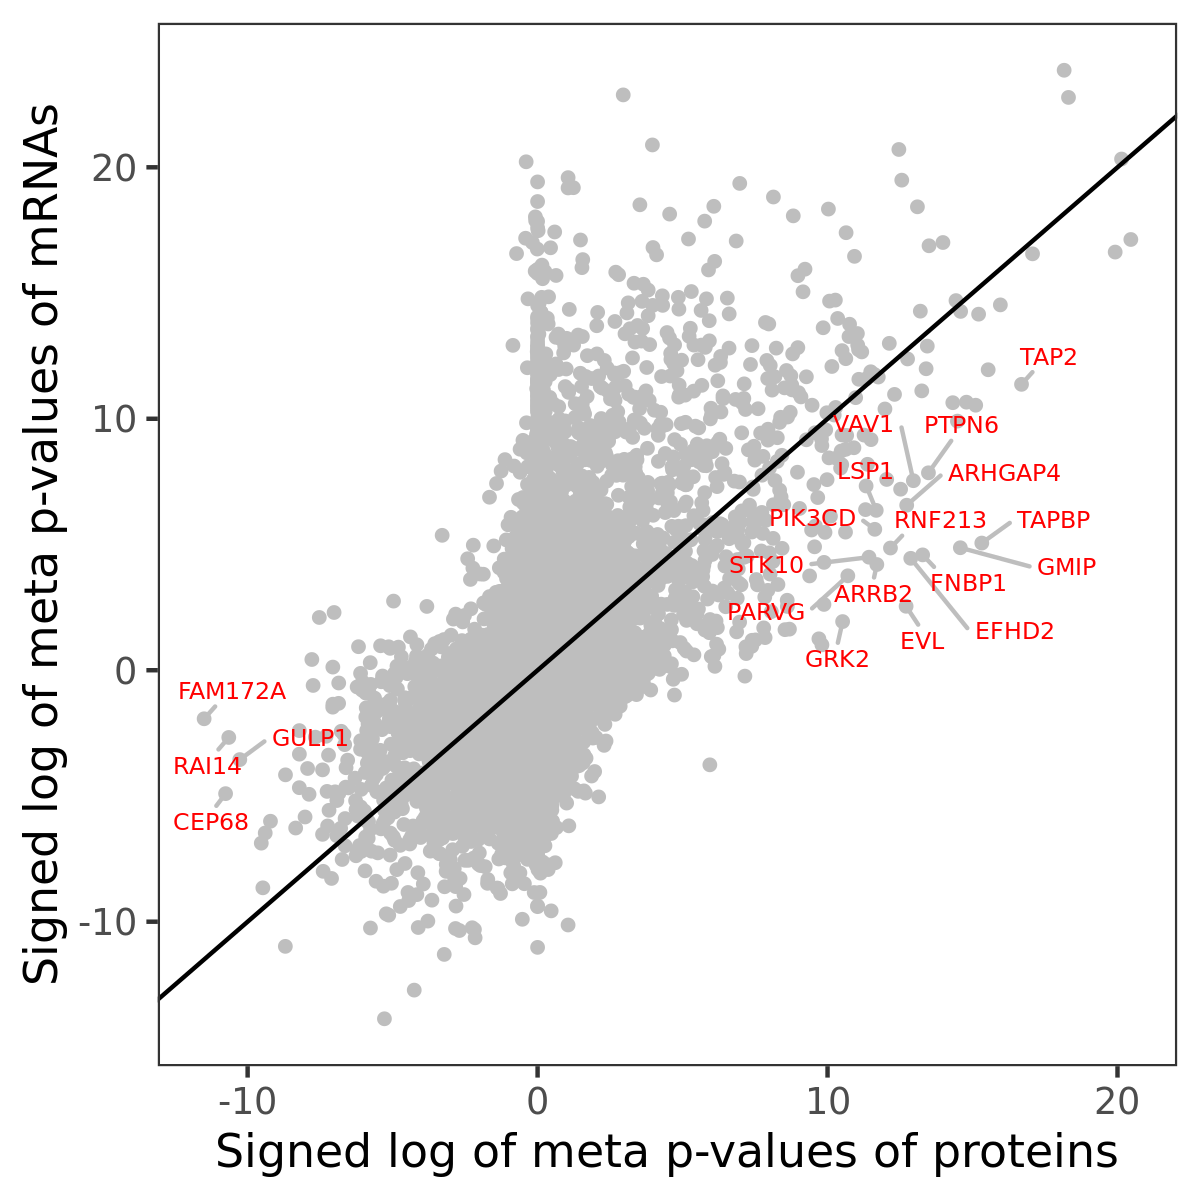
Association of protein abundance of genes
Signed p-values | ||||||||||||
|---|---|---|---|---|---|---|---|---|---|---|---|---|
Gene | Meta P | BRCA | CCRCC | COAD | GBM | HNSCC | LSCC | LUAD | OV | PDAC | UCEC | |
| No matching records found | ||||||||||||
Gene set enrichment analysis
Submit genes and the common logarithm of the p-values of their association with xcell: T cell gamma delta to WebGestalt.
Phosphosite association
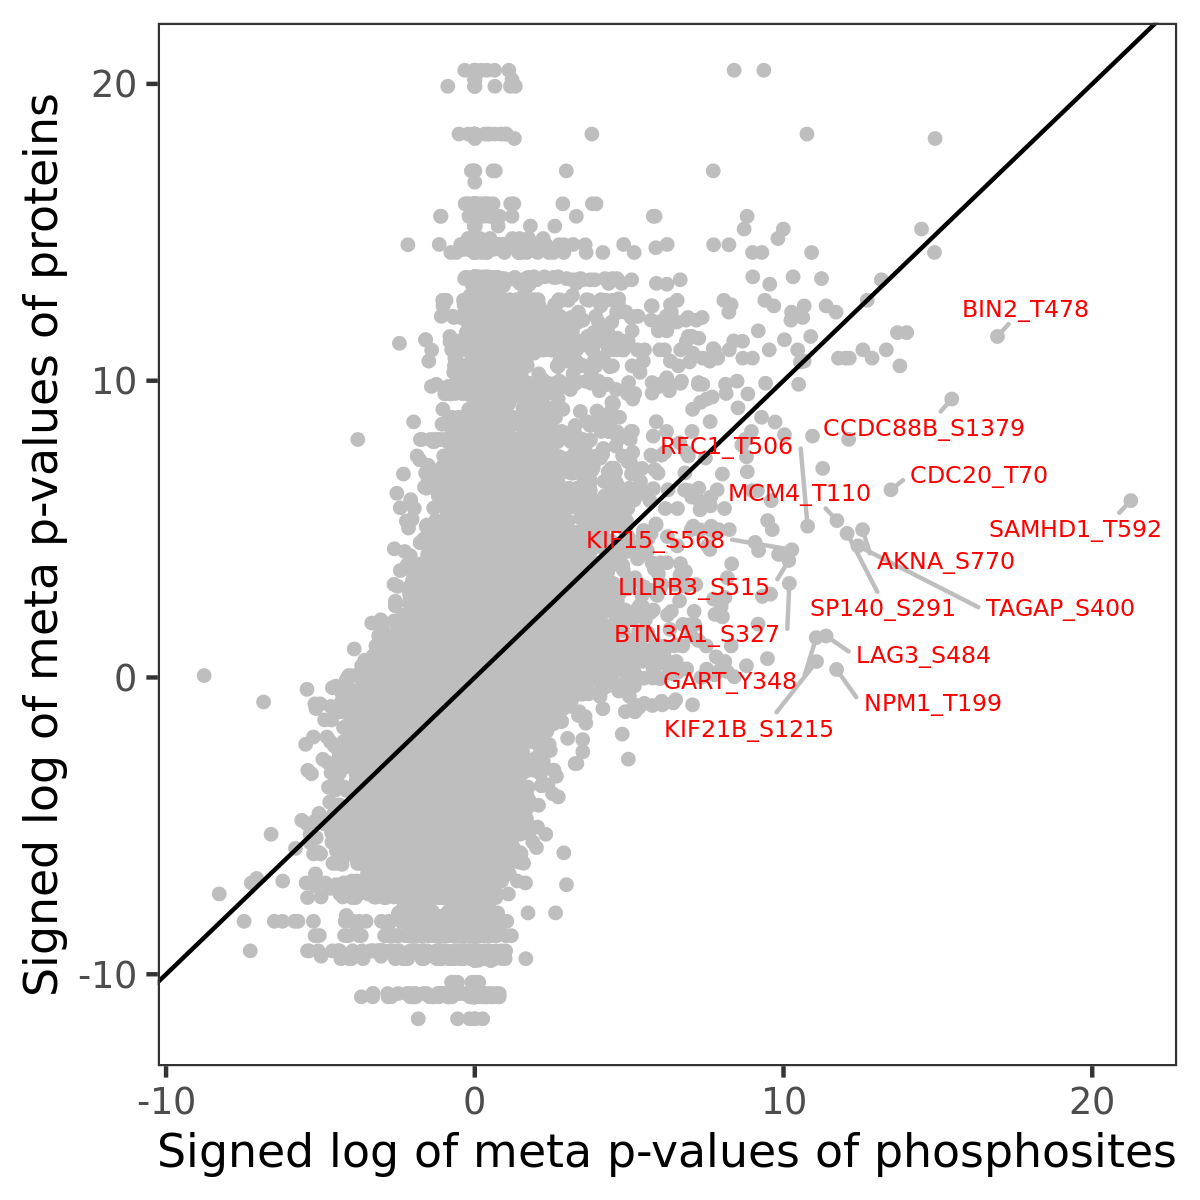
Number of significant genes with P-value ≤ 10-6 for each cohorts are summarized in the bar plot. The scatter plot highlights significant associations diven by phosphorylation rather than protein abundance.
Signed p-values | |||||||||||||
|---|---|---|---|---|---|---|---|---|---|---|---|---|---|
Gene | Protein | Site | Meta P | BRCA | CCRCC | COAD | GBM | HNSCC | LSCC | LUAD | OV | PDAC | UCEC |
| No matching records found | |||||||||||||
Gene set enrichment analysis
Submit phosphorylation sites and the common logarithm of the p-values of their association with xcell: T cell gamma delta to WebGestalt.