Basic information
- Phenotype
- HALLMARK_GLYCOLYSIS
- Description
- Enrichment score representing genes involved in glycolysis. The score was calculated using ssGSEA on the RNA data (Z-score transformed coding genes with expression in at least 50% of the samples in a cohort).
- Source
- http://www.gsea-msigdb.org/gsea/msigdb/cards/HALLMARK_GLYCOLYSIS.html
- Method
- Single sample gene set enrichment analysis (ssGSEA) was performed for each cancer type using gene-wise Z-scores of the RNA expression data (RSEM) for the MSigDB Hallmark gene sets v7.0 (PMID: 26771021) via the ssGSEA2.0 R package (PMID: 30563849). RNA data were filtered to coding genes with < 50% 0 expression. (Parameters: sample.norm.type="rank", weight=0.75, statistic="area.under.RES", nperm=1000, min.overlap=10). Pathway activity scores are normalized enrichment scores from ssGSEA.
- Genes
-
- ADORA2B
- AGL
- AGRN
- AK3
- AK4
- AKR1A1
- ALDH7A1
- ALDH9A1
- ALDOA
- ALG1
- Array
- ALDOB
- ANG
- ANGPTL4
- ANKZF1
- ARPP19
- ARTN
- AURKA
- B3GALT6
- B3GAT1
- B3GAT3
- B3GNT3
- Array
- B4GALT1
- B4GALT2
- B4GALT4
- B4GALT7
- BIK
- BPNT1
- CACNA1H
- CAPN5
- CASP6
- CD44
- CDK1
- CENPA
- CHPF
- CHPF2
- CHST1
- CHST12
- CHST2
- CHST4
- CHST6
- CITED2
- CLDN3
- CLDN9
- CLN6
- COG2
- COL5A1
- COPB2
- CTH
- CXCR4
- CYB5A
- DCN
- DDIT4
- DEPDC1
- DLD
- DPYSL4
- DSC2
- ECD
- EFNA3
- EGFR
- EGLN3
- ELF3
- ENO1
- ENO2
- ERO1A
- EXT1
- EXT2
- FAM162A
- FBP2
- FKBP4
- FUT8
- G6PD
- GAL3ST1
- GALE
- GALK1
- GALK2
- GAPDHS
- GCLC
- GFPT1
- GLCE
- GLRX
- GMPPA
- GMPPB
- GNE
- GNPDA1
- GOT1
- GOT2
- GPC1
- GPC3
- GPC4
- GPR87
- GUSB
- GYS1
- GYS2
- HAX1
- HDLBP
- HK2
- HMMR
- HOMER1
- HS2ST1
- HS6ST2
- HSPA5
- IDH1
- IDUA
- IER3
- IGFBP3
- IL13RA1
- IRS2
- ISG20
- KDELR3
- KIF20A
- KIF2A
- LCT
- LDHA
- LDHC
- LHPP
- LHX9
- MDH1
- MDH2
- ME1
- ME2
- MED24
- MERTK
- MET
- MIF
- MIOX
- MPI
- MXI1
- NANP
- NASP
- NDST3
- NDUFV3
- NSDHL
- NT5E
- P4HA1
- P4HA2
- PAM
- PAXIP1
- PC
- PDK3
- PFKFB1
- PFKP
- PGAM1
- PGAM2
- PGK1
- PGM2
- PHKA2
- PKM
- PKP2
- PLOD1
- PLOD2
- PMM2
- POLR3K
- PPFIA4
- PPIA
- PPP2CB
- PRPS1
- PSMC4
- PYGB
- PYGL
- QSOX1
- RARS1
- RBCK1
- RPE
- RRAGD
- SAP30
- SDC1
- SDC2
- SDC3
- SDHC
- SLC16A3
- SLC25A10
- SLC25A13
- SLC35A3
- SLC37A4
- SOD1
- SOX9
- SPAG4
- SRD5A3
- STC1
- STC2
- STMN1
- TALDO1
- TFF3
- TGFA
- TGFBI
- TKTL1
- TPBG
- TPI1
- TPST1
- TSTA3
- TXN
- UGP2
- VCAN
- VEGFA
- VLDLR
- XYLT2
- ZNF292
- More...
Gene association
Number of significant genes with P-value ≤ 10-6 for each cohorts are summarized in bar plots. The scatter plot highlights significant associations diven by protein rather than mRNA abundance.

Association of protein abundance of genes
Signed p-values | ||||||||||||
|---|---|---|---|---|---|---|---|---|---|---|---|---|
Gene | Meta P | BRCA | CCRCC | COAD | GBM | HNSCC | LSCC | LUAD | OV | PDAC | UCEC | |
| No matching records found | ||||||||||||
Gene set enrichment analysis
Submit genes and the common logarithm of the p-values of their association with HALLMARK_GLYCOLYSIS to WebGestalt.
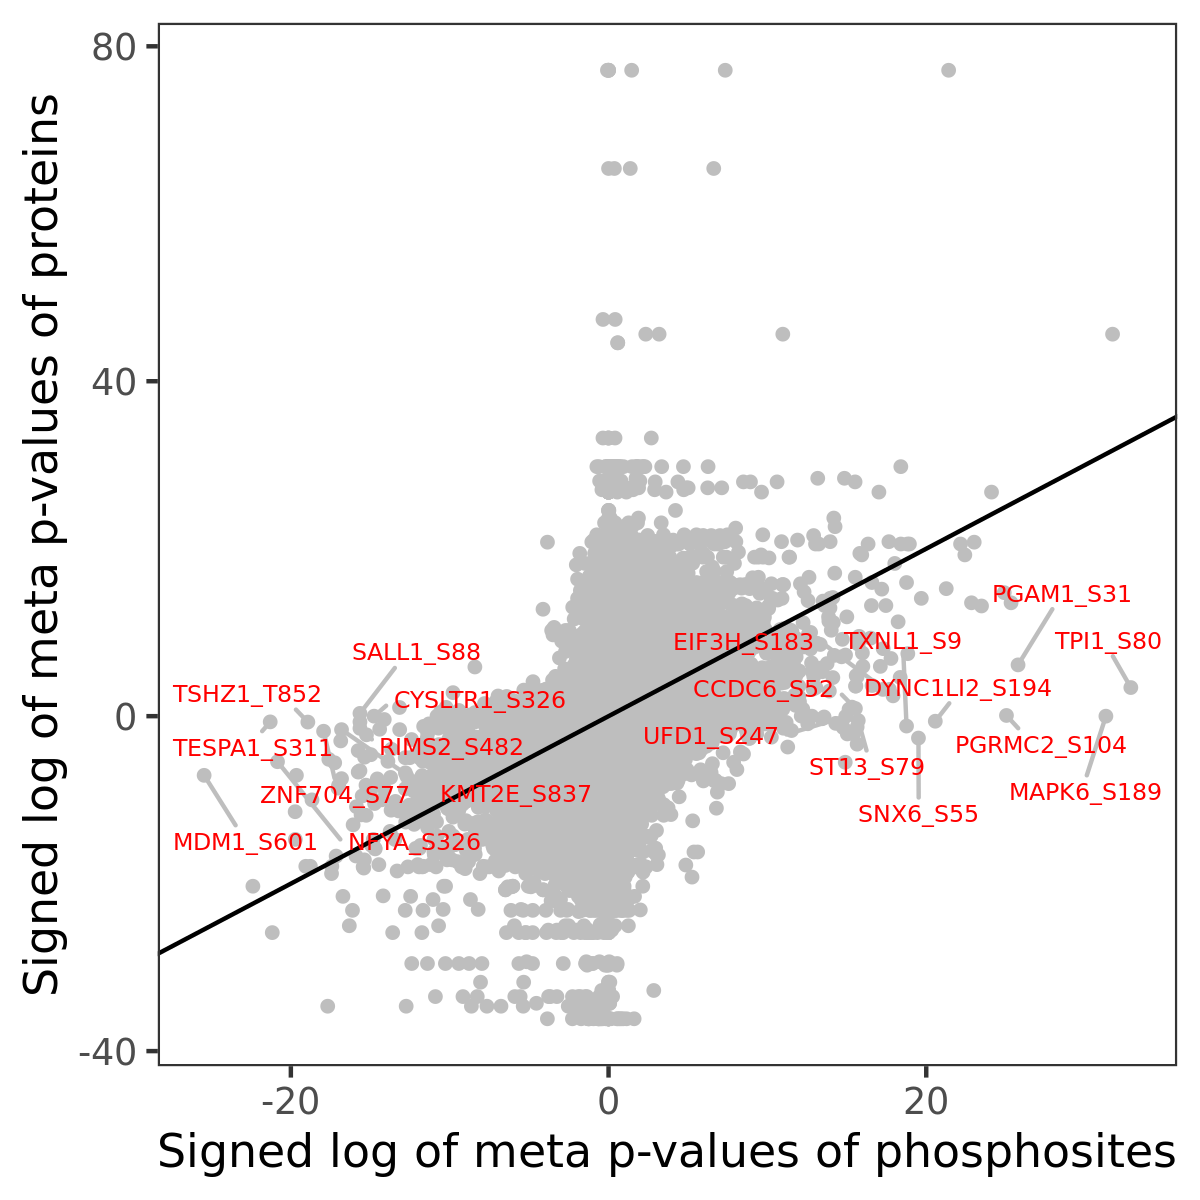
Phosphosite association
Number of significant genes with P-value ≤ 10-6 for each cohorts are summarized in the bar plot. The scatter plot highlights significant associations diven by phosphorylation rather than protein abundance.
Signed p-values | |||||||||||||
|---|---|---|---|---|---|---|---|---|---|---|---|---|---|
Gene | Protein | Site | Meta P | BRCA | CCRCC | COAD | GBM | HNSCC | LSCC | LUAD | OV | PDAC | UCEC |
| No matching records found | |||||||||||||
Gene set enrichment analysis
Submit phosphorylation sites and the common logarithm of the p-values of their association with HALLMARK_GLYCOLYSIS to WebGestalt.