Basic information
- Phenotype
- HALLMARK_INTERFERON_ALPHA_RESPONSE
- Description
- Enrichment score representing the interferon alpha response. The score was calculated using ssGSEA on the RNA data (Z-score transformed coding genes with expression in at least 50% of the samples in a cohort).
- Source
- http://www.gsea-msigdb.org/gsea/msigdb/cards/HALLMARK_INTERFERON_ALPHA_RESPONSE.html
- Method
- Single sample gene set enrichment analysis (ssGSEA) was performed for each cancer type using gene-wise Z-scores of the RNA expression data (RSEM) for the MSigDB Hallmark gene sets v7.0 (PMID: 26771021) via the ssGSEA2.0 R package (PMID: 30563849). RNA data were filtered to coding genes with < 50% 0 expression. (Parameters: sample.norm.type="rank", weight=0.75, statistic="area.under.RES", nperm=1000, min.overlap=10). Pathway activity scores are normalized enrichment scores from ssGSEA.
- Genes
-
- B2M
- BATF2
- BST2
- C1S
- CASP1
- CASP8
- CCRL2
- CD47
- CD74
- CMPK2
- CMTR1
- CNP
- CSF1
- CXCL10
- CXCL11
- DDX60
- DHX58
- EIF2AK2
- ELF1
- EPSTI1
- GBP2
- GBP4
- GMPR
- HELZ2
- HERC6
- HLA-C
- IFI27
- IFI30
- IFI35
- IFI44
- IFI44L
- IFIH1
- IFIT2
- IFIT3
- IFITM1
- IFITM2
- IFITM3
- IL15
- IL4R
- IL7
- IRF1
- IRF2
- IRF7
- IRF9
- ISG15
- ISG20
- LAMP3
- LAP3
- LGALS3BP
- LPAR6
- LY6E
- MOV10
- MVB12A
- MX1
- NCOA7
- NMI
- NUB1
- OASL
- OGFR
- PARP12
- PARP14
- PARP9
- PLSCR1
- PNPT1
- PROCR
- PSMA3
- PSMB8
- PSMB9
- PSME1
- PSME2
- RIPK2
- RNF31
- RSAD2
- RTP4
- SAMD9
- SAMD9L
- SELL
- SLC25A28
- SP110
- STAT2
- TAP1
- TDRD7
- Array
- TENT5A
- TMEM140
- TRAFD1
- TRIM14
- TRIM21
- TRIM25
- TRIM26
- TRIM5
- TXNIP
- UBA7
- UBE2L6
- USP18
- WARS1
- More...
Gene association
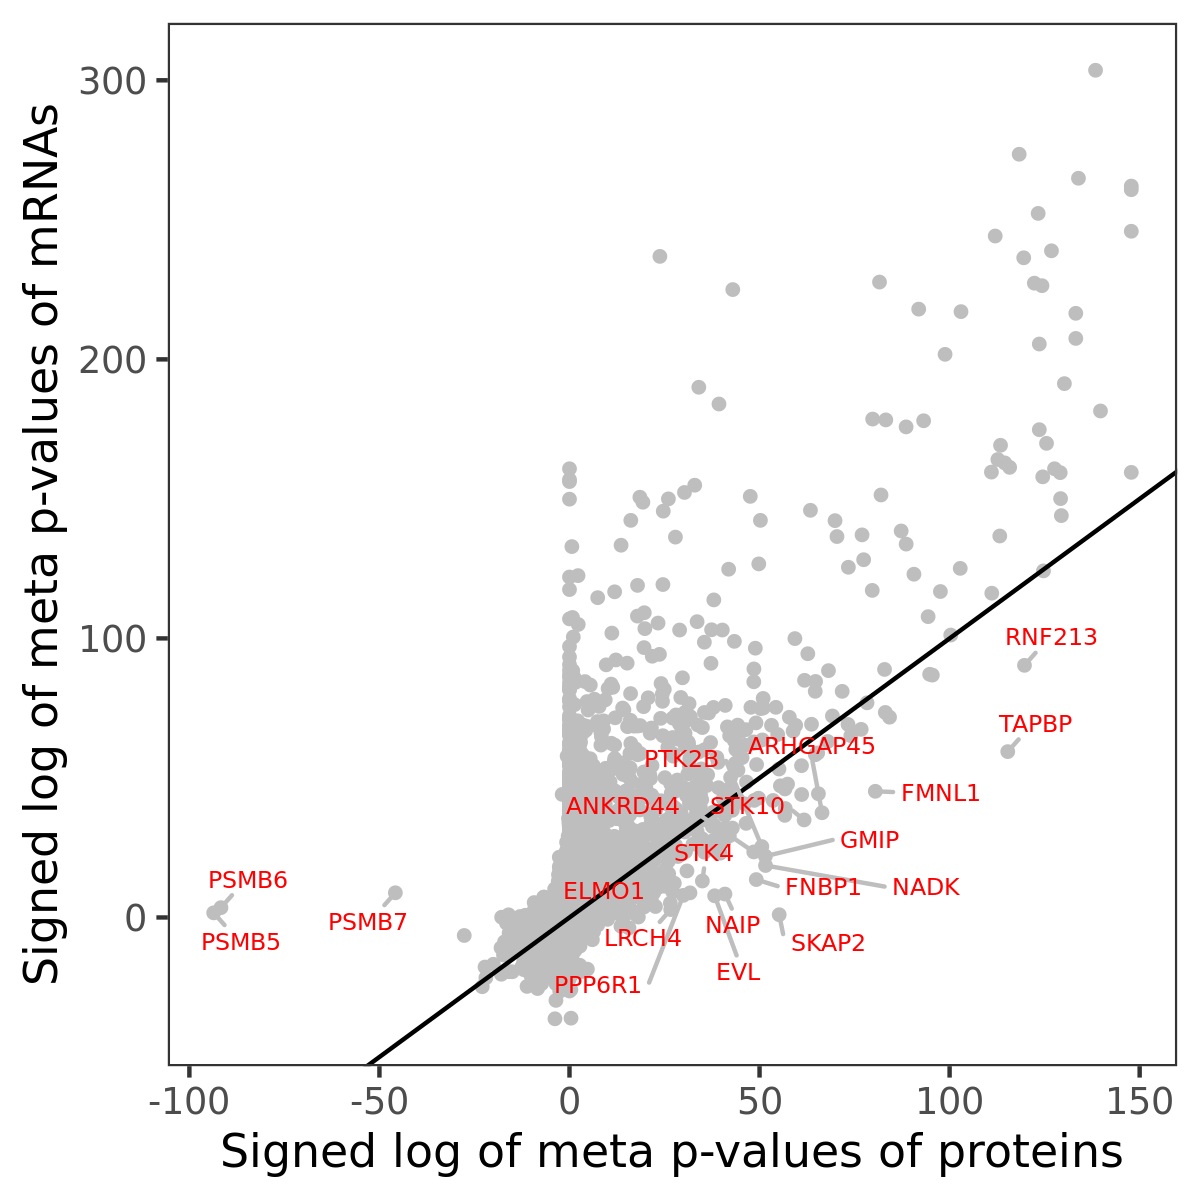
Number of significant genes with P-value ≤ 10-6 for each cohorts are summarized in bar plots. The scatter plot highlights significant associations diven by protein rather than mRNA abundance.
Association of protein abundance of genes
| Signed p-values | |||||||||||
|---|---|---|---|---|---|---|---|---|---|---|---|
| Gene | Meta P | BRCA | CCRCC | COAD | GBM | HNSCC | LSCC | LUAD | OV | PDAC | UCEC |
Gene set enrichment analysis
Submit genes and the common logarithm of the p-values of their association with HALLMARK_INTERFERON_ALPHA_RESPONSE to WebGestalt.
Phosphosite association
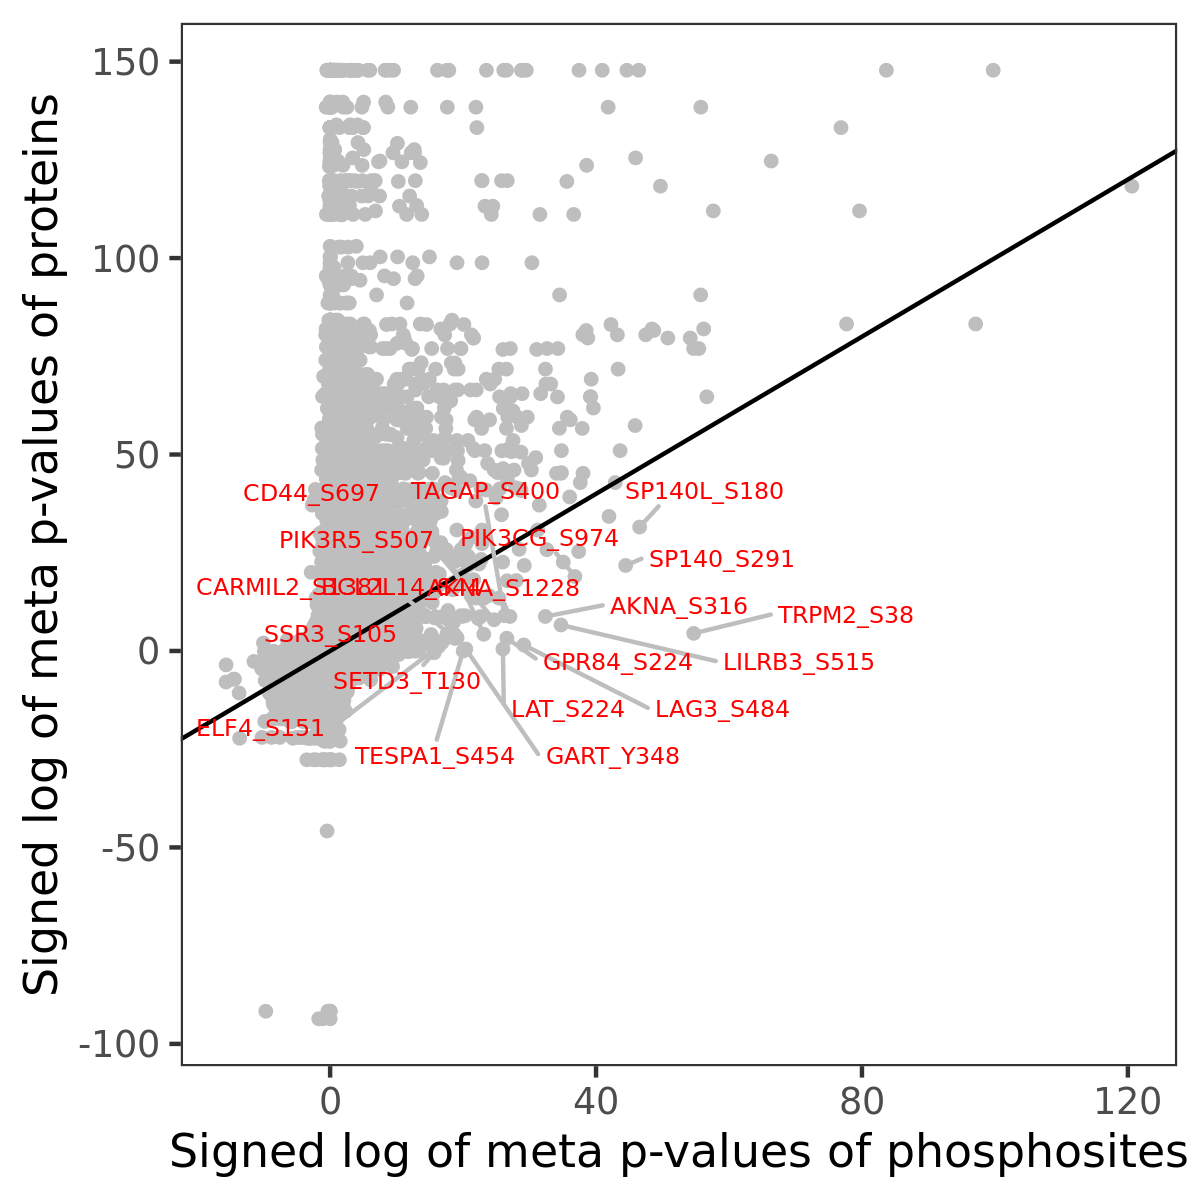
Number of significant genes with P-value ≤ 10-6 for each cohorts are summarized in the bar plot. The scatter plot highlights significant associations diven by phosphorylation rather than protein abundance.
| Signed p-values | |||||||||||||
|---|---|---|---|---|---|---|---|---|---|---|---|---|---|
| Gene | Protein | Site | Meta P | BRCA | CCRCC | COAD | GBM | HNSCC | LSCC | LUAD | OV | PDAC | UCEC |
Gene set enrichment analysis
Submit phosphorylation sites and the common logarithm of the p-values of their association with HALLMARK_INTERFERON_ALPHA_RESPONSE to WebGestalt.