Basic information
- Phenotype
- HALLMARK_PI3K_AKT_MTOR_SIGNALING
- Description
- Enrichment score representing PI3K/AKT/MTOR signaling. The score was calculated using ssGSEA on the RNA data (Z-score transformed coding genes with expression in at least 50% of the samples in a cohort).
- Source
- http://www.gsea-msigdb.org/gsea/msigdb/cards/HALLMARK_PI3K_AKT_MTOR_SIGNALING.html
- Method
- Single sample gene set enrichment analysis (ssGSEA) was performed for each cancer type using gene-wise Z-scores of the RNA expression data (RSEM) for the MSigDB Hallmark gene sets v7.0 (PMID: 26771021) via the ssGSEA2.0 R package (PMID: 30563849). RNA data were filtered to coding genes with < 50% 0 expression. (Parameters: sample.norm.type="rank", weight=0.75, statistic="area.under.RES", nperm=1000, min.overlap=10). Pathway activity scores are normalized enrichment scores from ssGSEA.
- Genes
-
- ACTR2
- ACTR3
- ADCY2
- AKT1
- AKT1S1
- AP2M1
- ARF1
- ARHGDIA
- ARPC3
- ATF1
- CAB39
- CAB39L
- CALR
- CAMK4
- CDK1
- CDK2
- CDK4
- CDKN1A
- CDKN1B
- CFL1
- CLTC
- CSNK2B
- CXCR4
- DAPP1
- DDIT3
- DUSP3
- E2F1
- ECSIT
- EGFR
- EIF4E
- FASLG
- FGF17
- FGF22
- FGF6
- GNA14
- GNGT1
- GRB2
- GRK2
- GSK3B
- HRAS
- HSP90B1
- IL2RG
- IL4
- IRAK4
- ITPR2
- LCK
- MAP2K3
- MAP2K6
- MAP3K7
- MAPK1
- MAPK10
- MAPK8
- MAPK9
- MAPKAP1
- MKNK1
- MKNK2
- MYD88
- NCK1
- NFKBIB
- NGF
- NOD1
- PAK4
- PDK1
- PFN1
- PIK3R3
- PIKFYVE
- PIN1
- PITX2
- PLA2G12A
- PLCB1
- PLCG1
- PPP1CA
- PPP2R1B
- PRKAA2
- PRKAG1
- PRKAR2A
- PRKCB
- PTEN
- PTPN11
- RAC1
- RAF1
- RALB
- RIPK1
- RIT1
- RPS6KA1
- RPS6KA3
- RPTOR
- SFN
- SLA
- SLC2A1
- SMAD2
- SQSTM1
- STAT2
- TBK1
- THEM4
- TIAM1
- TNFRSF1A
- TRAF2
- TRIB3
- TSC2
- UBE2D3
- UBE2N
- VAV3
- YWHAB
- More...
Gene association
Number of significant genes with P-value ≤ 10-6 for each cohorts are summarized in bar plots. The scatter plot highlights significant associations diven by protein rather than mRNA abundance.
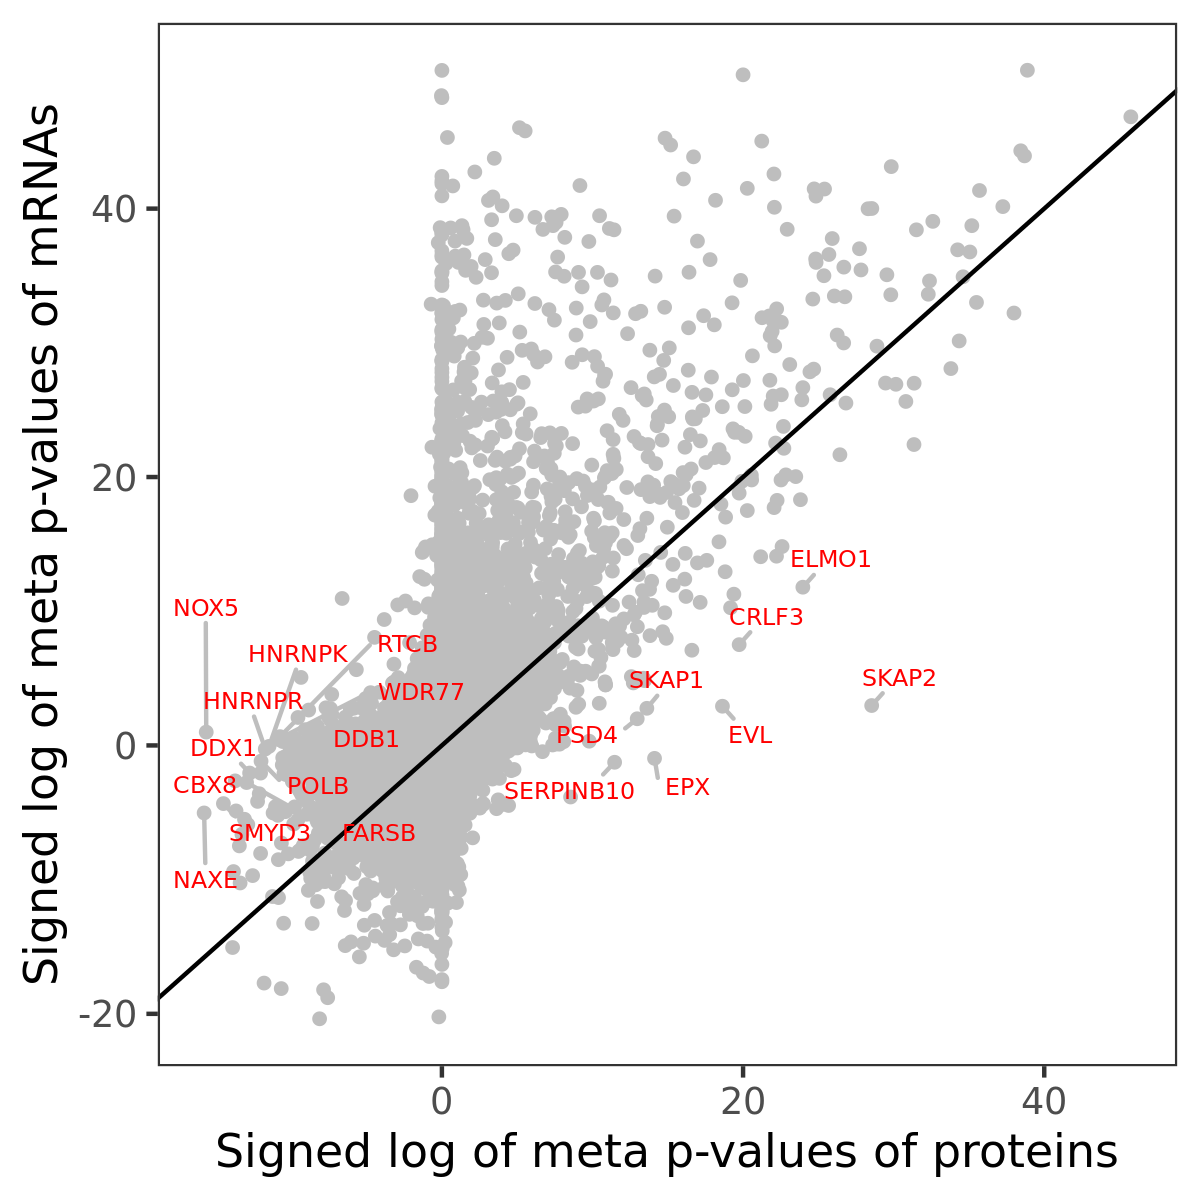
Association of protein abundance of genes
| Signed p-values | |||||||||||
|---|---|---|---|---|---|---|---|---|---|---|---|
| Gene | Meta P | BRCA | CCRCC | COAD | GBM | HNSCC | LSCC | LUAD | OV | PDAC | UCEC |
Gene set enrichment analysis
Submit genes and the common logarithm of the p-values of their association with HALLMARK_PI3K_AKT_MTOR_SIGNALING to WebGestalt.
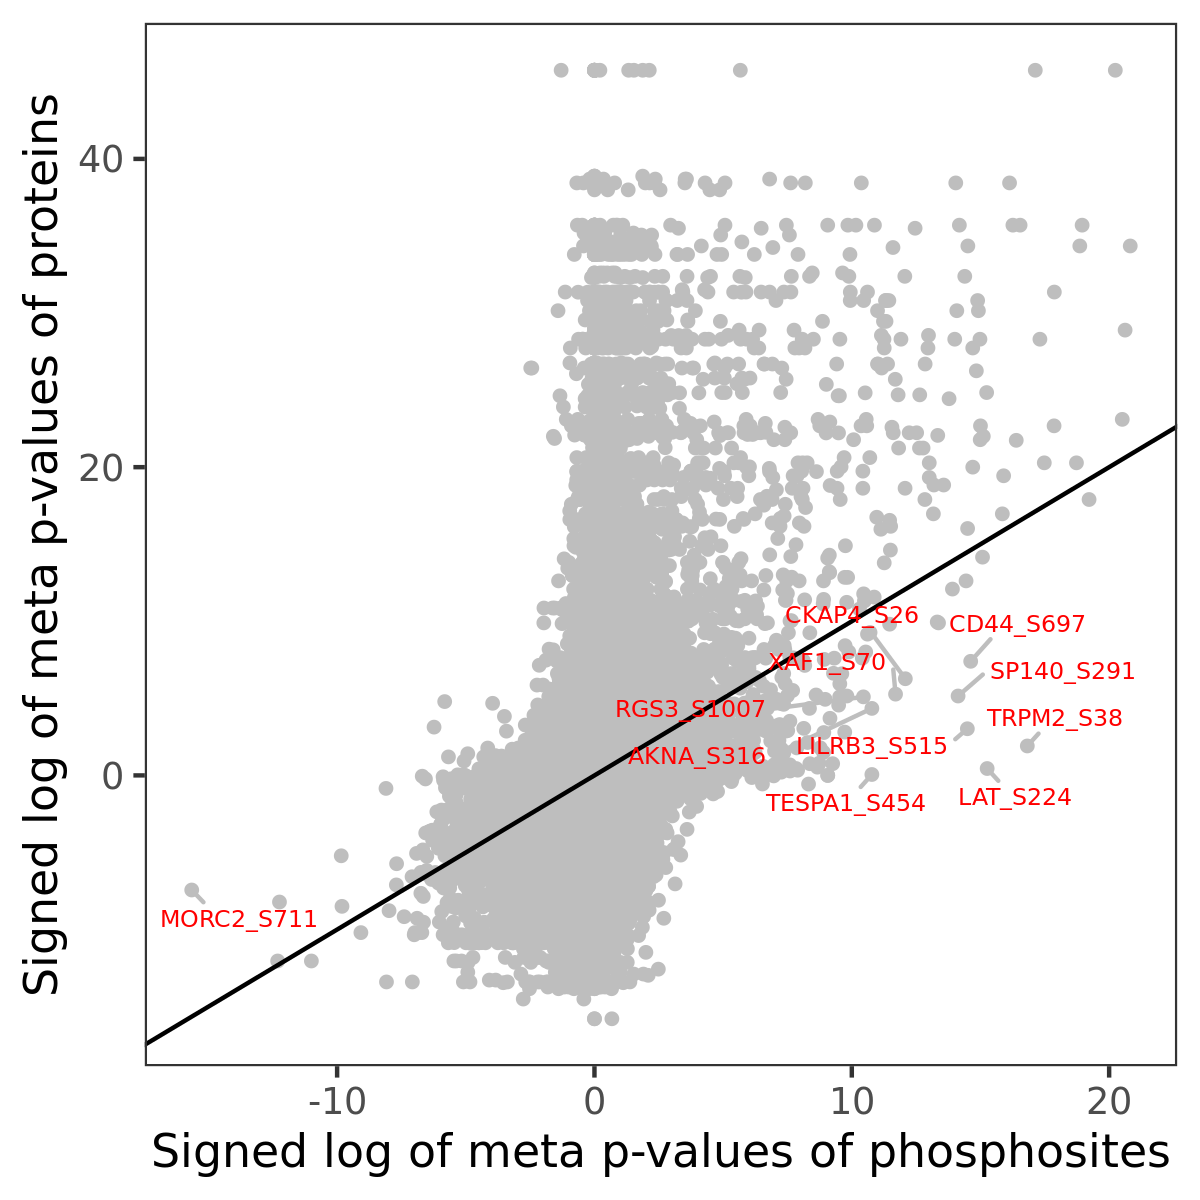
Phosphosite association
Number of significant genes with P-value ≤ 10-6 for each cohorts are summarized in the bar plot. The scatter plot highlights significant associations diven by phosphorylation rather than protein abundance.
| Signed p-values | |||||||||||||
|---|---|---|---|---|---|---|---|---|---|---|---|---|---|
| Gene | Protein | Site | Meta P | BRCA | CCRCC | COAD | GBM | HNSCC | LSCC | LUAD | OV | PDAC | UCEC |
Gene set enrichment analysis
Submit phosphorylation sites and the common logarithm of the p-values of their association with HALLMARK_PI3K_AKT_MTOR_SIGNALING to WebGestalt.