Basic information
- Phenotype
- HALLMARK_UNFOLDED_PROTEIN_RESPONSE
- Description
- Enrichment score representing the unfolded protein response. The score was calculated using ssGSEA on the RNA data (Z-score transformed coding genes with expression in at least 50% of the samples in a cohort).
- Source
- http://www.gsea-msigdb.org/gsea/msigdb/cards/HALLMARK_UNFOLDED_PROTEIN_RESPONSE.html
- Method
- Single sample gene set enrichment analysis (ssGSEA) was performed for each cancer type using gene-wise Z-scores of the RNA expression data (RSEM) for the MSigDB Hallmark gene sets v7.0 (PMID: 26771021) via the ssGSEA2.0 R package (PMID: 30563849). RNA data were filtered to coding genes with < 50% 0 expression. (Parameters: sample.norm.type="rank", weight=0.75, statistic="area.under.RES", nperm=1000, min.overlap=10). Pathway activity scores are normalized enrichment scores from ssGSEA.
- Genes
-
- ARFGAP1
- ASNS
- ATF3
- ATF4
- ATF6
- ATP6V0D1
- BAG3
- BANF1
- CALR
- CCL2
- CEBPB
- CEBPG
- CHAC1
- CKS1B
- CNOT4
- CNOT6
- CXXC1
- DCP2
- Array
- DCP1A
- DCTN1
- DDIT4
- DDX10
- DKC1
- DNAJA4
- DNAJB9
- DNAJC3
- EDC4
- EDEM1
- EEF2
- EIF2AK3
- EIF2S1
- EIF4A1
- EIF4A2
- EIF4A3
- EIF4E
- EIF4EBP1
- EIF4G1
- ERN1
- ERO1A
- EXOC2
- EXOSC1
- EXOSC10
- EXOSC2
- EXOSC4
- EXOSC5
- EXOSC9
- FKBP14
- FUS
- GEMIN4
- GOSR2
- H2AX
- HERPUD1
- HSP90B1
- HSPA5
- HSPA9
- HYOU1
- IARS1
- IFIT1
- IGFBP1
- IMP3
- KDELR3
- KHSRP
- KIF5B
- LSM1
- LSM4
- MTHFD2
- MTREX
- NABP1
- NFYA
- NFYB
- NHP2
- NOLC1
- NOP14
- NOP56
- NPM1
- PAIP1
- PARN
- PDIA5
- PDIA6
- POP4
- PREB
- PSAT1
- RPS14
- RRP9
- SDAD1
- SEC11A
- SEC31A
- SERP1
- SHC1
- SLC1A4
- SLC30A5
- SLC7A5
- SPCS1
- SPCS3
- SRPRA
- SRPRB
- SSR1
- STC2
- TARS1
- TATDN2
- TSPYL2
- TTC37
- TUBB2A
- VEGFA
- WFS1
- WIPI1
- XBP1
- XPOT
- YIF1A
- YWHAZ
- ZBTB17
- More...
Gene association
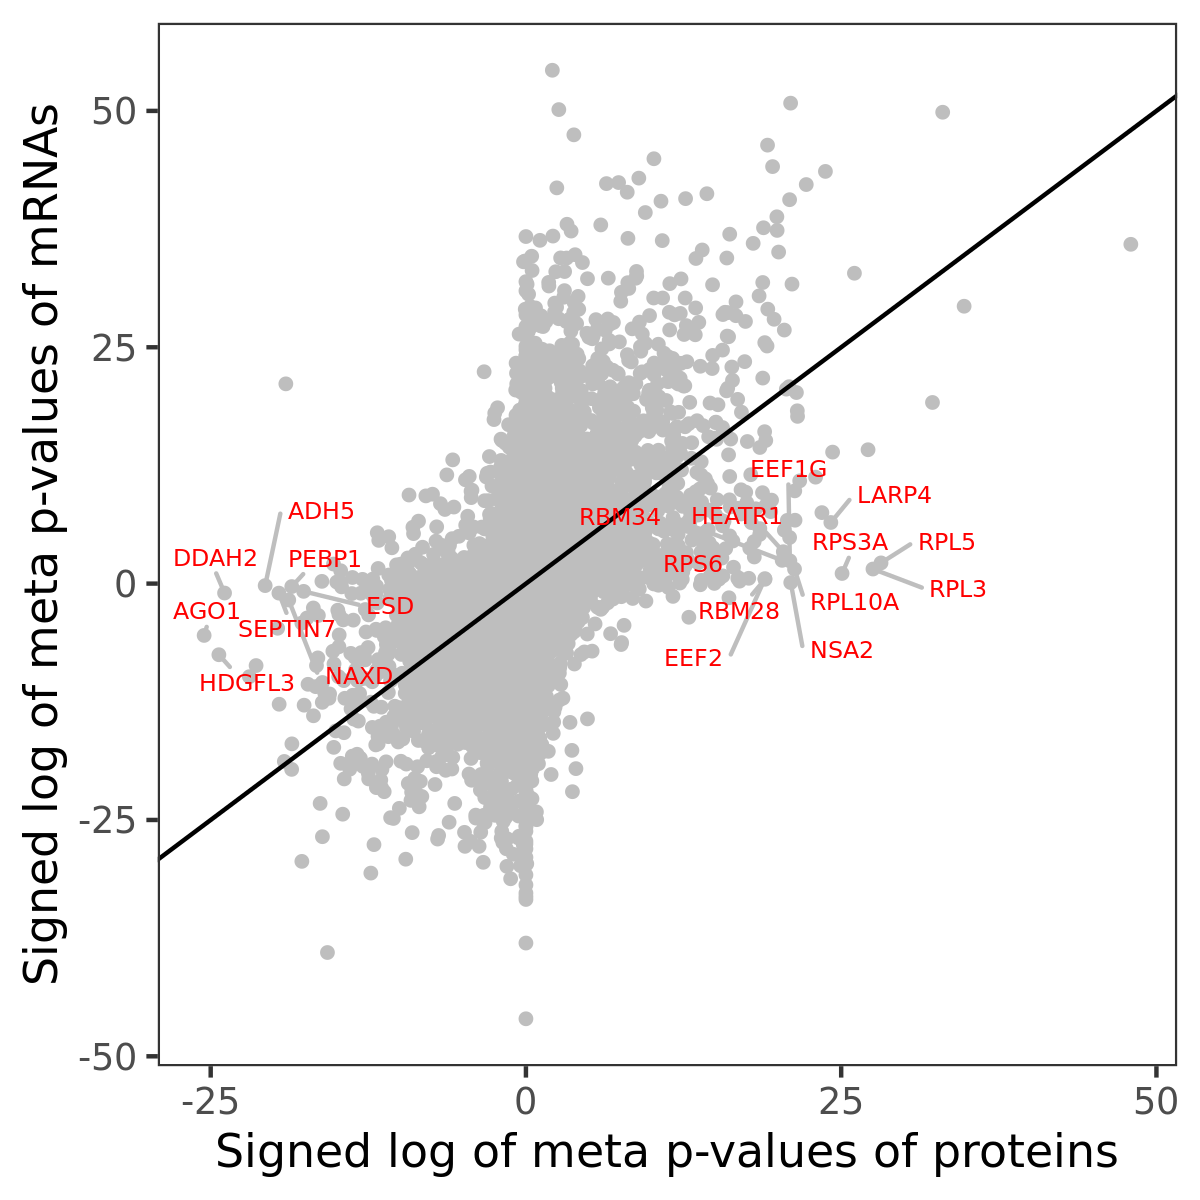
Number of significant genes with P-value ≤ 10-6 for each cohorts are summarized in bar plots. The scatter plot highlights significant associations diven by protein rather than mRNA abundance.

Association of protein abundance of genes
Signed p-values | ||||||||||||
|---|---|---|---|---|---|---|---|---|---|---|---|---|
Gene | Meta P | BRCA | CCRCC | COAD | GBM | HNSCC | LSCC | LUAD | OV | PDAC | UCEC | |
| No matching records found | ||||||||||||
Gene set enrichment analysis
Submit genes and the common logarithm of the p-values of their association with HALLMARK_UNFOLDED_PROTEIN_RESPONSE to WebGestalt.
Phosphosite association
Number of significant genes with P-value ≤ 10-6 for each cohorts are summarized in the bar plot. The scatter plot highlights significant associations diven by phosphorylation rather than protein abundance.

Signed p-values | |||||||||||||
|---|---|---|---|---|---|---|---|---|---|---|---|---|---|
Gene | Protein | Site | Meta P | BRCA | CCRCC | COAD | GBM | HNSCC | LSCC | LUAD | OV | PDAC | UCEC |
| No matching records found | |||||||||||||
Gene set enrichment analysis
Submit phosphorylation sites and the common logarithm of the p-values of their association with HALLMARK_UNFOLDED_PROTEIN_RESPONSE to WebGestalt.