Basic information
- Phenotype
- HALLMARK_UV_RESPONSE_DN
- Description
- Enrichment score representing the genes decreased in response to ultraviolet radiation. The score was calculated using ssGSEA on the RNA data (Z-score transformed coding genes with expression in at least 50% of the samples in a cohort).
- Source
- http://www.gsea-msigdb.org/gsea/msigdb/cards/HALLMARK_UV_RESPONSE_DN.html
- Method
- Single sample gene set enrichment analysis (ssGSEA) was performed for each cancer type using gene-wise Z-scores of the RNA expression data (RSEM) for the MSigDB Hallmark gene sets v7.0 (PMID: 26771021) via the ssGSEA2.0 R package (PMID: 30563849). RNA data were filtered to coding genes with < 50% 0 expression. (Parameters: sample.norm.type="rank", weight=0.75, statistic="area.under.RES", nperm=1000, min.overlap=10). Pathway activity scores are normalized enrichment scores from ssGSEA.
- Genes
-
- ACVR2A
- ADD3
- ADGRL2
- ADORA2B
- AGGF1
- AKT3
- AMPH
- ANXA2
- ANXA4
- APBB2
- ARHGEF9
- ATP2B1
- ATP2B4
- ATP2C1
- ATRN
- ATRX
- ATXN1
- BCKDHB
- BDNF
- BHLHE40
- BMPR1A
- CACNA1A
- CAP2
- CAV1
- CCN1
- Array
- CDC42BPA
- CDK13
- CDKN1B
- CDON
- CELF2
- CITED2
- COL11A1
- COL1A1
- COL1A2
- COL3A1
- COL5A2
- DAB2
- DBP
- DDAH1
- DLC1
- DLG1
- DMAC2L
- DUSP1
- DYRK1A
- EFEMP1
- ERBB2
- F3
- FBLN5
- FHL2
- FYN
- FZD2
- GCNT1
- GJA1
- GRK5
- HAS2
- ICA1
- ID1
- IGF1R
- IGFBP5
- INPP4B
- INSIG1
- IRS1
- ITGB3
- KALRN
- KCNMA1
- KIT
- LAMC1
- LDLR
- LPAR1
- LTBP1
- MAGI2
- MAP1B
- MAP2K5
- MAPK14
- MET
- MGLL
- MGMT
- MIOS
- MMP16
- MRPS31
- MT1E
- MTA1
- MYC
- NEK7
- NFIB
- NFKB1
- NIPBL
- NOTCH2
- NR1D2
- NR3C1
- NRP1
- PDGFRB
- PDLIM5
- PEX14
- PHF3
- PIAS3
- PIK3CD
- PIK3R3
- PLCB4
- PLPP3
- PMP22
- PPARG
- PRDM2
- PRKAR2B
- PRKCA
- PRKCE
- PTEN
- PTGFR
- PTPRM
- RASA2
- RBPMS
- RGS4
- RND3
- RUNX1
- RXRA
- SCAF8
- SCHIP1
- SCN8A
- SDC2
- SERPINE1
- SFMBT1
- SIPA1L1
- SLC22A18
- SLC7A1
- SMAD3
- SMAD7
- SNAI2
- SPOP
- SRI
- SYNE1
- SYNJ2
- TENT4A
- TFPI
- TGFBR2
- TGFBR3
- TJP1
- TOGARAM1
- VAV2
- VLDLR
- WDR37
- YTHDC1
- ZMIZ1
- More...
Gene association
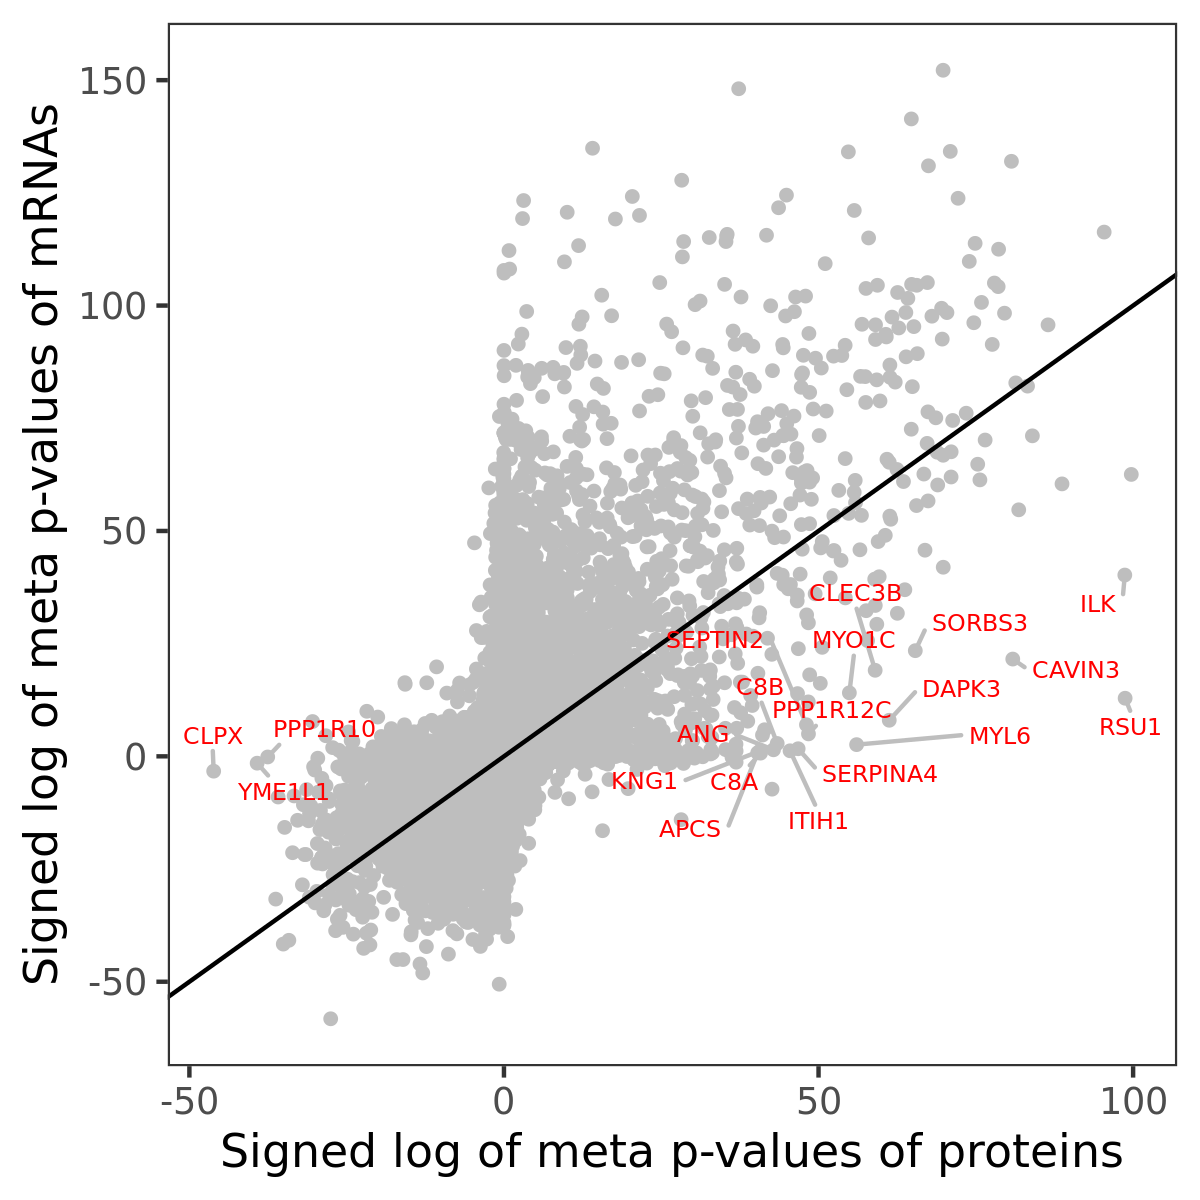
Number of significant genes with P-value ≤ 10-6 for each cohorts are summarized in bar plots. The scatter plot highlights significant associations diven by protein rather than mRNA abundance.

Association of protein abundance of genes
Signed p-values | ||||||||||||
|---|---|---|---|---|---|---|---|---|---|---|---|---|
Gene | Meta P | BRCA | CCRCC | COAD | GBM | HNSCC | LSCC | LUAD | OV | PDAC | UCEC | |
| No matching records found | ||||||||||||
Gene set enrichment analysis
Submit genes and the common logarithm of the p-values of their association with HALLMARK_UV_RESPONSE_DN to WebGestalt.
Phosphosite association
Number of significant genes with P-value ≤ 10-6 for each cohorts are summarized in the bar plot. The scatter plot highlights significant associations diven by phosphorylation rather than protein abundance.

Signed p-values | |||||||||||||
|---|---|---|---|---|---|---|---|---|---|---|---|---|---|
Gene | Protein | Site | Meta P | BRCA | CCRCC | COAD | GBM | HNSCC | LSCC | LUAD | OV | PDAC | UCEC |
| No matching records found | |||||||||||||
Gene set enrichment analysis
Submit phosphorylation sites and the common logarithm of the p-values of their association with HALLMARK_UV_RESPONSE_DN to WebGestalt.