Basic information
- Phenotype
- PROGENy: Androgen
- Description
- Score representing the activity of the androgen-activated pathway. It was calculated using the PROGENy tool on the RNA data (genes with mean FPKM expression >0).
- Source
- https://www.nature.com/articles/s41467-017-02391-6; https://www.sciencedirect.com/science/article/abs/pii/S1874939919302287?via%3Dihub
- Method
- The PROGENy scores were inferred using the R package progeny (V1.10.0) (PMID: 29295995) with default parameters using the RNA expression data (FPKM). Genes with mean expression = 0 in a cohort were removed from the analysis.
- Genes
-
- ACSL3
- ADAM7
- ADPRM
- AFF3
- ARHGEF26
- AZGP1
- BMPR1B
- C1orf116
- CAMKK2
- CBLL1
- CDK8
- CENPN
- CHRNA2
- CLDN8
- CROT
- CSGALNACT1
- CTBP1
- CTNNA2
- DHCR24
- DNASE2B
- DNM1L
- DNM1L
- EAF2
- ECI2
- ELK4
- ELL2
- ENDOD1
- F5
- FRK
- FUT8
- FZD5
- GCG
- GNMT
- GPR63
- GRHL2
- GRIK1
- HOXC13
- IGF1
- IGF1R
- IQGAP2
- KCNMA1
- KCNN2
- KLF15
- KLK2
- KLK3
- LIFR
- LPAR3
- LRIG1
- LRRC31
- LRRFIP2
- MAF
- MAK
- MALT1
- MANEA
- MBOAT2
- MCCC2
- MPC2
- MPHOSPH9
- MRPS18A
- MTMR9
- MYBPC1
- MYNN
- NCAPD3
- NKX3-1
- NPPC
- NSMAF
- OPRK1
- PAK1IP1
- PDE9A
- PEX10
- PGC
- PHF8
- PMEPA1
- PPP2CB
- PSMD8
- RAB3B
- SCAP
- SEC14L2
- SELENOP
- SGK1
- SI
- SLC15A2
- SLC38A4
- SLITRK3
- SNAI2
- SORD
- SPDEF
- STEAP4
- STK39
- SYTL2
- TLL1
- TMPRSS2
- TPD52
- TRPM8
- TSPAN3
- UAP1
- UBE2J1
- ZBTB16
- More...
Gene association
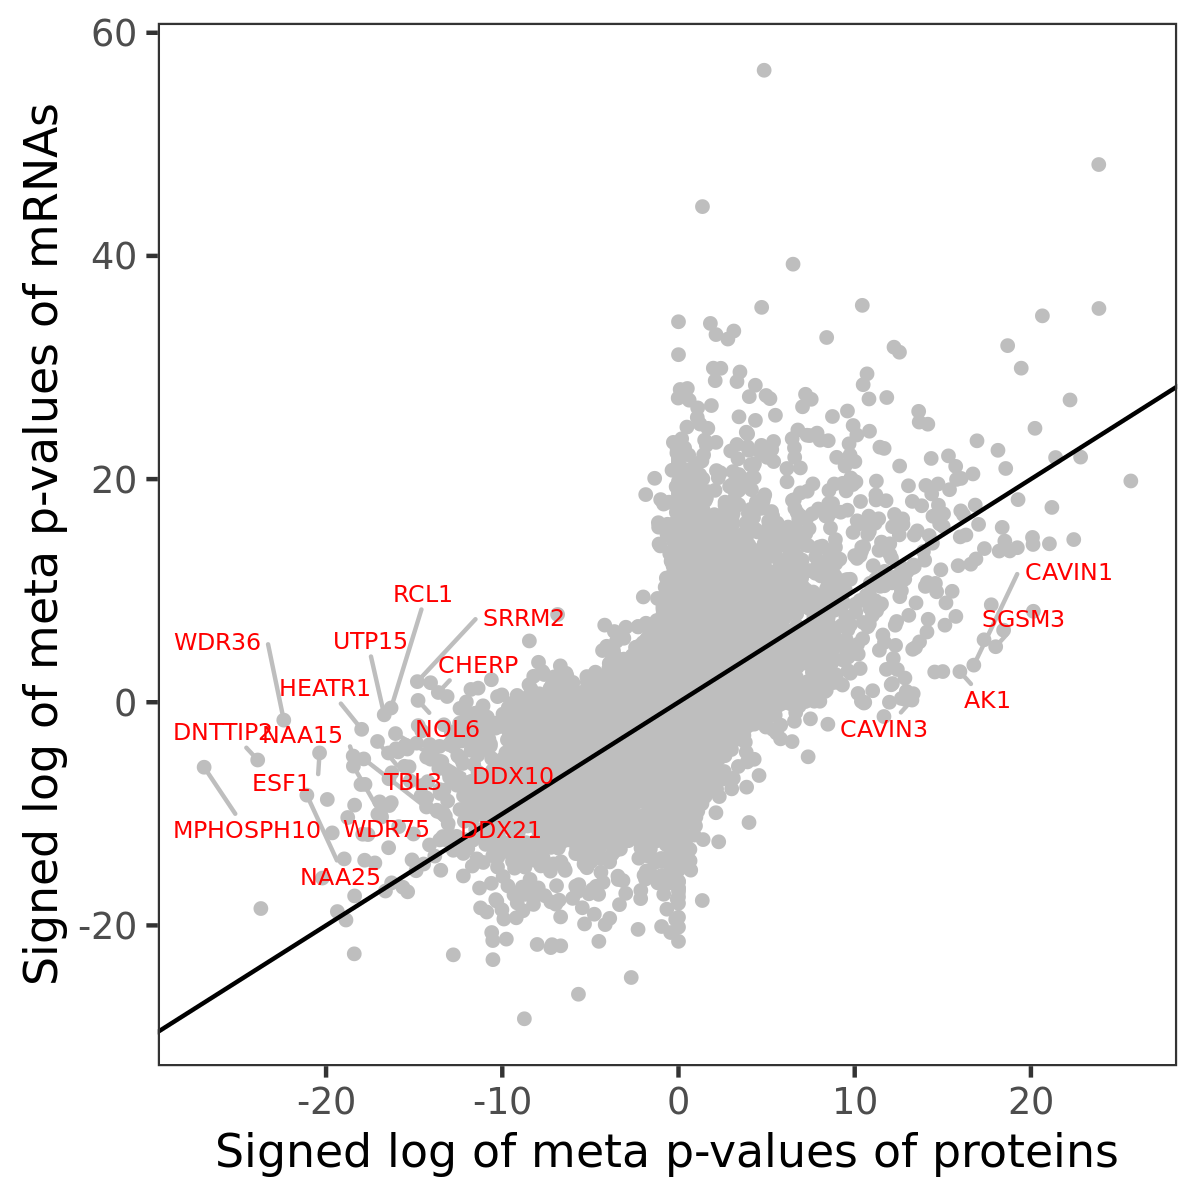
Number of significant genes with P-value ≤ 10-6 for each cohorts are summarized in bar plots. The scatter plot highlights significant associations diven by protein rather than mRNA abundance.

Association of protein abundance of genes
| Signed p-values | |||||||||||
|---|---|---|---|---|---|---|---|---|---|---|---|
| Gene | Meta P | BRCA | CCRCC | COAD | GBM | HNSCC | LSCC | LUAD | OV | PDAC | UCEC |
Gene set enrichment analysis
Submit genes and the common logarithm of the p-values of their association with PROGENy: Androgen to WebGestalt.
Phosphosite association
Number of significant genes with P-value ≤ 10-6 for each cohorts are summarized in the bar plot. The scatter plot highlights significant associations diven by phosphorylation rather than protein abundance.

| Signed p-values | |||||||||||||
|---|---|---|---|---|---|---|---|---|---|---|---|---|---|
| Gene | Protein | Site | Meta P | BRCA | CCRCC | COAD | GBM | HNSCC | LSCC | LUAD | OV | PDAC | UCEC |
Gene set enrichment analysis
Submit phosphorylation sites and the common logarithm of the p-values of their association with PROGENy: Androgen to WebGestalt.