Basic information
- Phenotype
- PROGENy: EGFR
- Description
- Score representing the activity of the EGFR pathway. It was calculated using the PROGENy tool on the RNA data (genes with mean FPKM expression >0).
- Source
- https://www.nature.com/articles/s41467-017-02391-6; https://www.sciencedirect.com/science/article/abs/pii/S1874939919302287?via%3Dihub
- Method
- The PROGENy scores were inferred using the R package progeny (V1.10.0) (PMID: 29295995) with default parameters using the RNA expression data (FPKM). Genes with mean expression = 0 in a cohort were removed from the analysis.
- Genes
-
- AEN
- AJUBA
- ANAPC16
- ATG2B
- ATXN3
- BBIP1
- BSDC1
- BZW1
- C2CD5
- CARF
- CBARP
- CCDC28A
- CEPT1
- CFL1
- CHRNA10
- Array
- CLDN8
- CRIPT
- DCAF13
- DSPP
- DUSP4
- DUSP5
- DUSP6
- DYNC2LI1
- EAPP
- EFHC1
- EGR3
- EGR4
- ELF2
- EPHA2
- ETFDH
- Array
- EXD3
- FOSL1
- FOXN3
- GOLPH3L
- GPR75
- GRAMD1C
- HAS3
- HMOX2
- KCNF1
- KIAA1522
- KLHDC2
- LAMC2
- LARP7
- LZTFL1
- MBTPS1
- MCCC1
- MDFI
- MYEOV
- Array
- MYO1A
- N4BP2L2
- NBR1
- NR1D2
- ODC1
- PCMTD2
- PEX1
- PHLDA1
- PHLDA2
- PLEK2
- PNISR
- PNP
- POT1
- PTHLH
- PWP2
- RAB33B
- RABGAP1
- RBM48
- RCOR3
- RNF146
- SENP7
- SH2D5
- SLC45A3
- SPATA2L
- SPOCD1
- SYF2
- TMEM59
- TRH
- TRIB1
- TRIM52
- TTC33
- TUBB4B
- VAV3
- WDR19
- XRCC3
- ZBED8
- ZNF224
- ZNF350
- ZNF451
- ZNF571
- ZNF75D
- ZSCAN31
- More...
Gene association
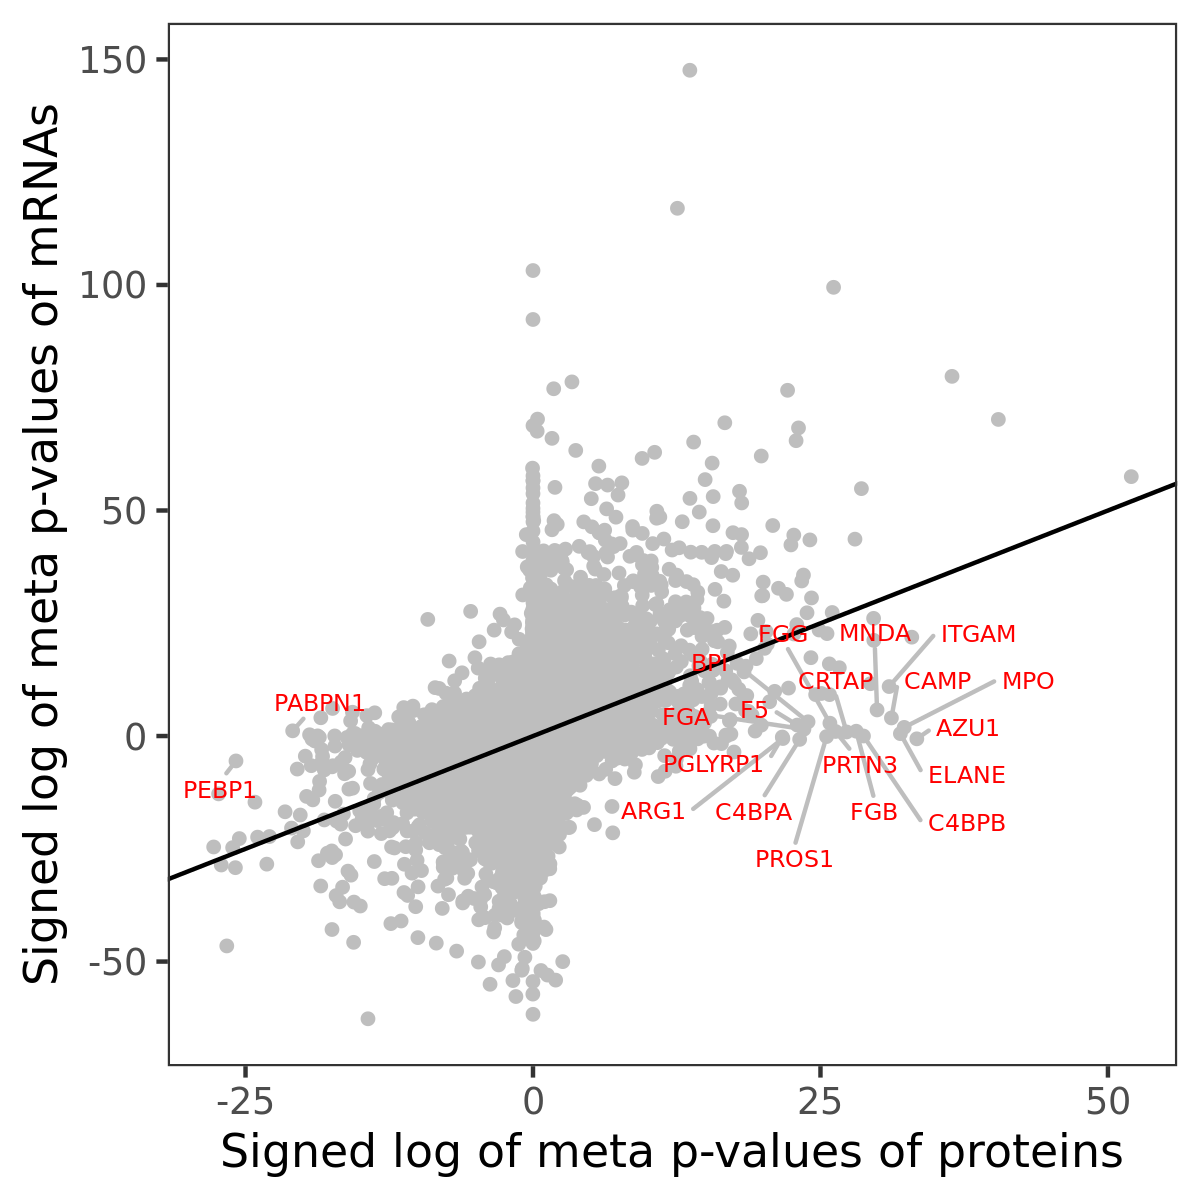
Number of significant genes with P-value ≤ 10-6 for each cohorts are summarized in bar plots. The scatter plot highlights significant associations diven by protein rather than mRNA abundance.
Association of protein abundance of genes
| Signed p-values | |||||||||||
|---|---|---|---|---|---|---|---|---|---|---|---|
| Gene | Meta P | BRCA | CCRCC | COAD | GBM | HNSCC | LSCC | LUAD | OV | PDAC | UCEC |
Gene set enrichment analysis
Submit genes and the common logarithm of the p-values of their association with PROGENy: EGFR to WebGestalt.
Phosphosite association
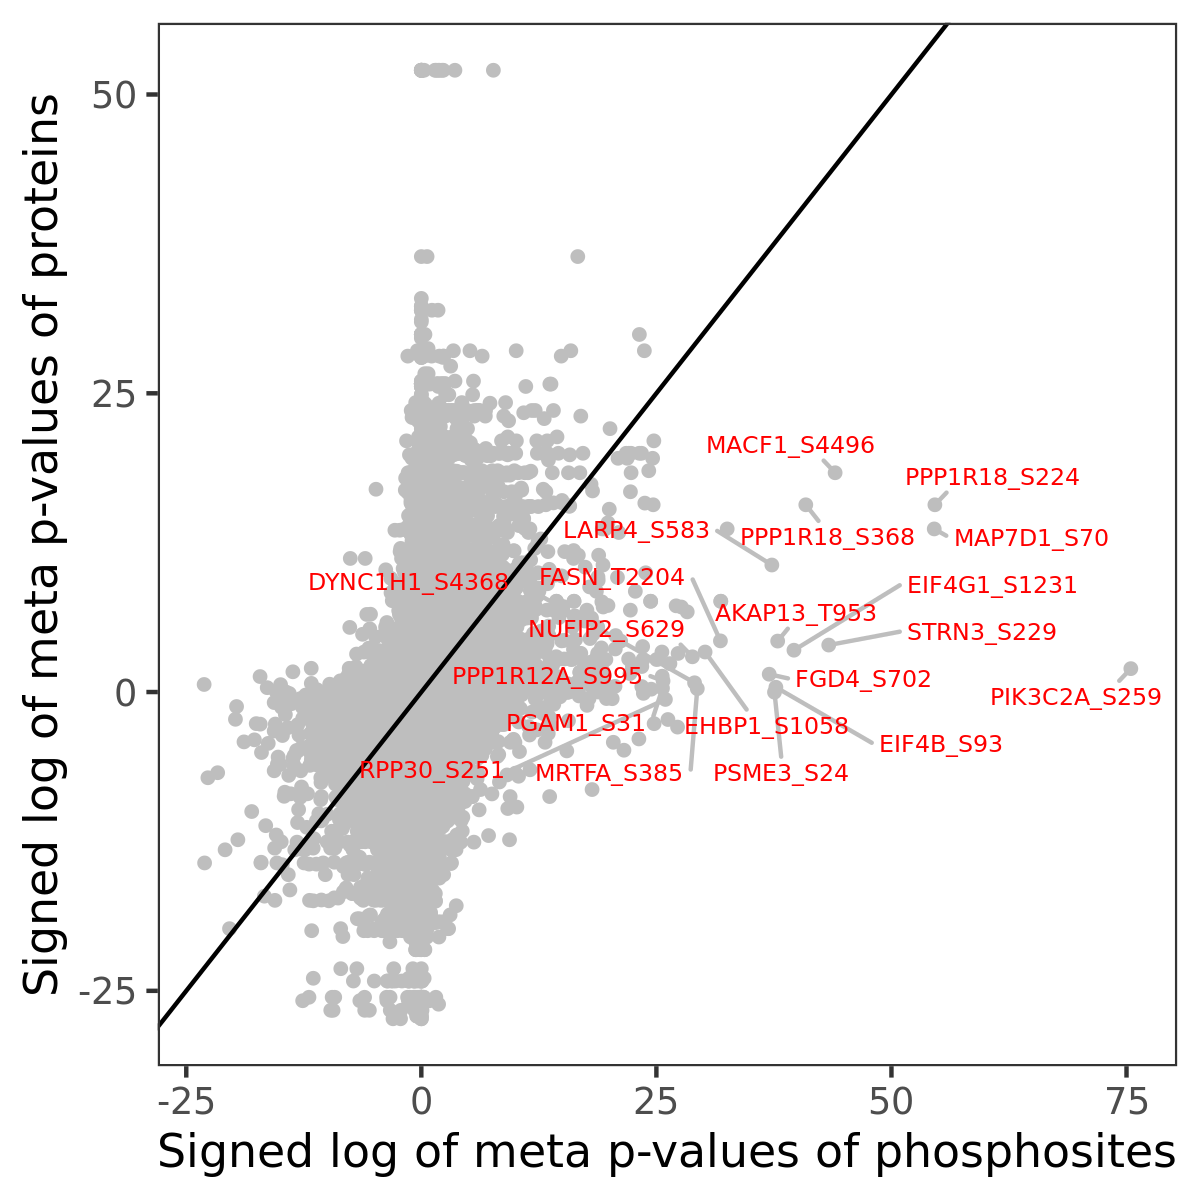
Number of significant genes with P-value ≤ 10-6 for each cohorts are summarized in the bar plot. The scatter plot highlights significant associations diven by phosphorylation rather than protein abundance.
| Signed p-values | |||||||||||||
|---|---|---|---|---|---|---|---|---|---|---|---|---|---|
| Gene | Protein | Site | Meta P | BRCA | CCRCC | COAD | GBM | HNSCC | LSCC | LUAD | OV | PDAC | UCEC |
Gene set enrichment analysis
Submit phosphorylation sites and the common logarithm of the p-values of their association with PROGENy: EGFR to WebGestalt.