Basic information
- Phenotype
- PROGENy: TGFb
- Description
- Score representing the activity of the TGFb pathway. It was calculated using the PROGENy tool on the RNA data (genes with mean FPKM expression >0).
- Source
- https://www.nature.com/articles/s41467-017-02391-6; https://www.sciencedirect.com/science/article/abs/pii/S1874939919302287?via%3Dihub
- Method
- The PROGENy scores were inferred using the R package progeny (V1.10.0) (PMID: 29295995) with default parameters using the RNA expression data (FPKM). Genes with mean expression = 0 in a cohort were removed from the analysis.
- Genes
-
- ABCA8
- ACOX3
- ACTC1
- ADAM12
- AK5
- ATP10A
- BCOR
- BGN
- BMPR2
- C3orf80
- CALD1
- CDH2
- CDKN2B
- CHST3
- CILP
- CLDN11
- CNN1
- COL1A1
- COL4A1
- COL4A2
- COL5A1
- COMP
- CRLF1
- Array
- DACT1
- DGKI
- EFR3B
- FBLN5
- FSTL3
- GALNT10
- GDF5
- GOPC
- GRIA3
- HSD17B6
- ID1
- ID3
- ID4
- IL11
- ISLR2
- ITGA11
- KIRREL3
- LECT2
- LIMS2
- LMCD1
- LRRC15
- LRRC32
- LRRN4CL
- LTBP2
- MEX3B
- MFAP4
- MRAS
- MSR1
- MYOZ1
- NEDD9
- NINJ2
- NOX1
- NOX4
- NUAK1
- OLFM2
- OPCML
- P2RX1
- PAWR
- PKNOX2
- PLCB4
- PLN
- PMEPA1
- PODNL1
- RASD2
- RASL11B
- RFLNB
- RUSC2
- Array
- RXFP1
- SAMD11
- SEMA7A
- SGPL1
- SH3PXD2A
- SKIL
- SLCO2A1
- SMAD6
- SMAD7
- SMURF1
- SNAI1
- SPECC1
- SPHK1
- SYNDIG1
- SYT15
- TNFSF4
- TPM1
- TSPAN2
- TUFT1
- UNC5B
- XRCC4
- XYLT1
- YIPF5
- More...
Gene association
Number of significant genes with P-value ≤ 10-6 for each cohorts are summarized in bar plots. The scatter plot highlights significant associations diven by protein rather than mRNA abundance.
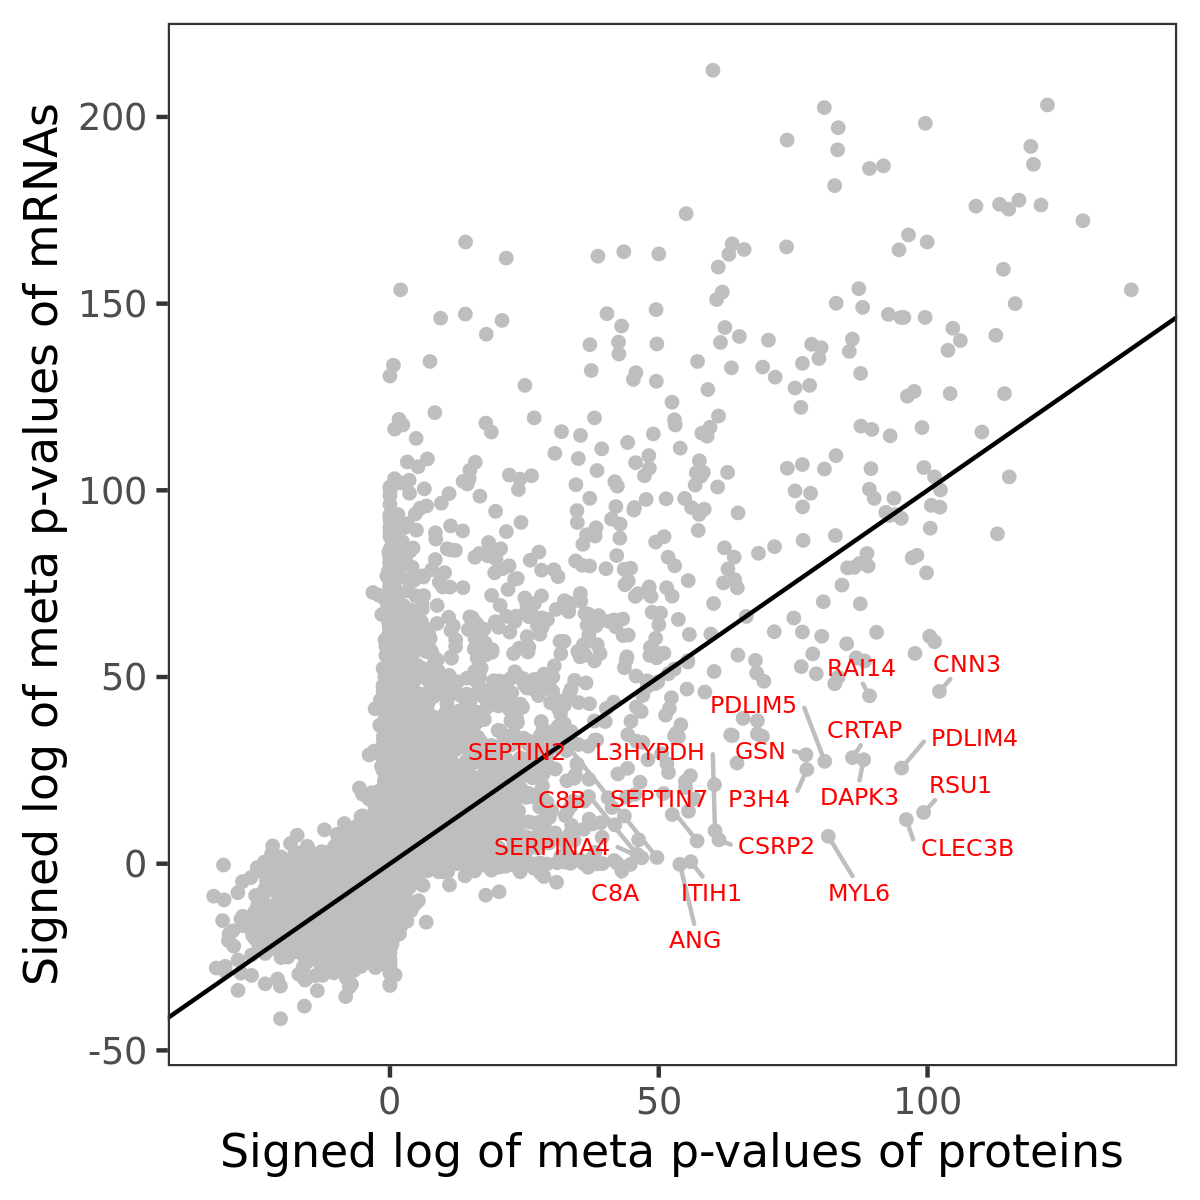
Association of protein abundance of genes
| Signed p-values | |||||||||||
|---|---|---|---|---|---|---|---|---|---|---|---|
| Gene | Meta P | BRCA | CCRCC | COAD | GBM | HNSCC | LSCC | LUAD | OV | PDAC | UCEC |
Gene set enrichment analysis
Submit genes and the common logarithm of the p-values of their association with PROGENy: TGFb to WebGestalt.
Phosphosite association
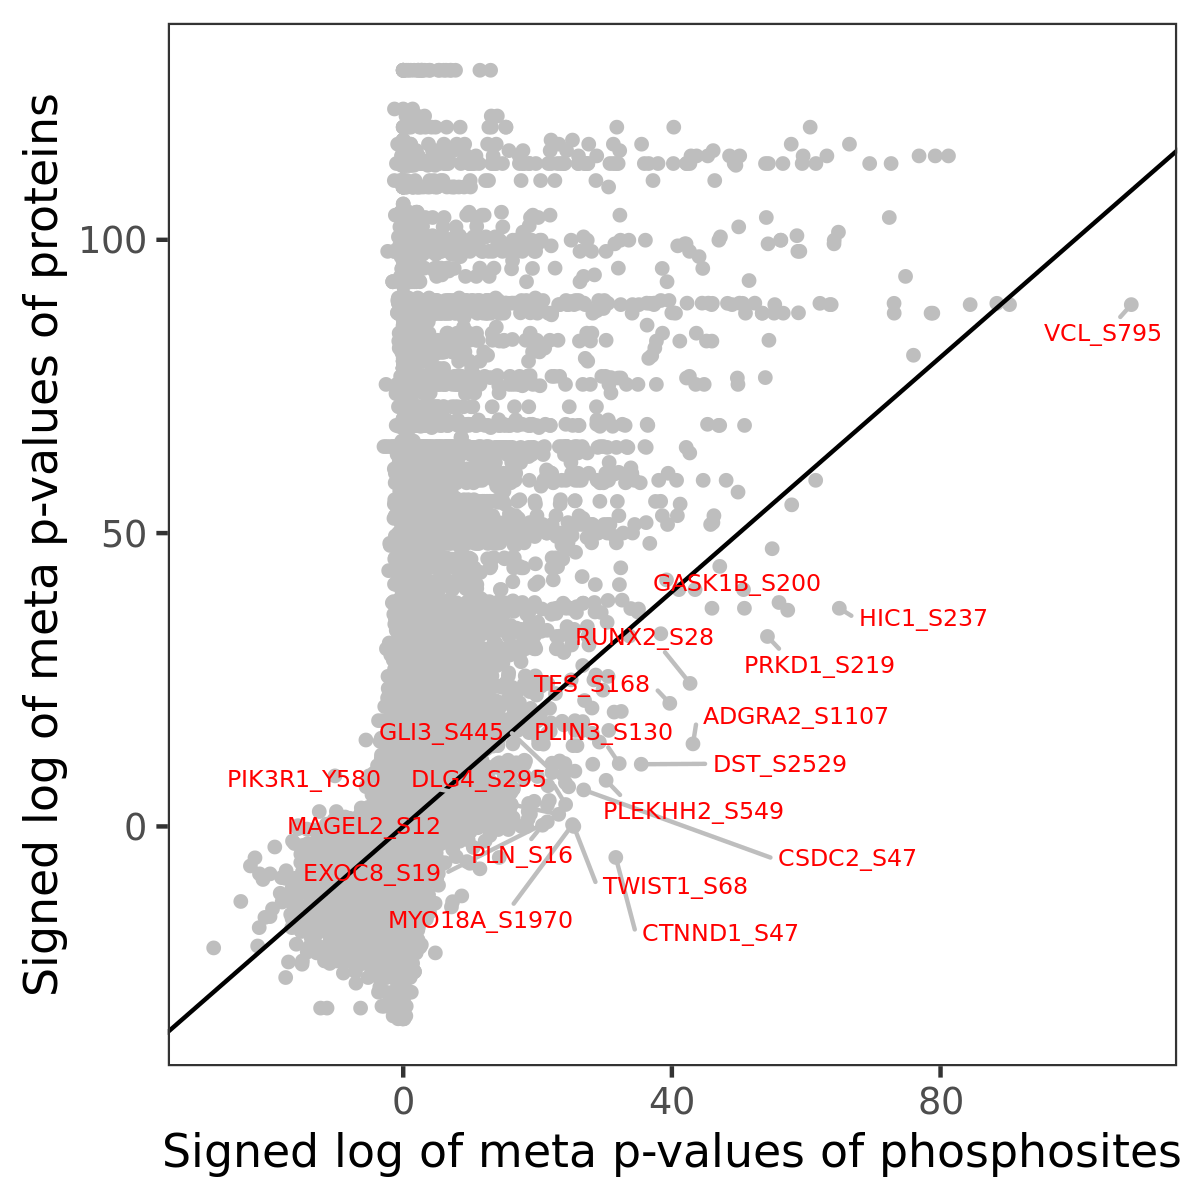
Number of significant genes with P-value ≤ 10-6 for each cohorts are summarized in the bar plot. The scatter plot highlights significant associations diven by phosphorylation rather than protein abundance.
| Signed p-values | |||||||||||||
|---|---|---|---|---|---|---|---|---|---|---|---|---|---|
| Gene | Protein | Site | Meta P | BRCA | CCRCC | COAD | GBM | HNSCC | LSCC | LUAD | OV | PDAC | UCEC |
Gene set enrichment analysis
Submit phosphorylation sites and the common logarithm of the p-values of their association with PROGENy: TGFb to WebGestalt.