Basic information
- Phenotype
- xcell: T cell CD4+ central memory
- Description
- Enrichment score inferring the proportion of central memory CD4+ T cells in the tumor derived from RNA data using the xCell tool.
- Source
- https://genomebiology.biomedcentral.com/articles/10.1186/s13059-017-1349-1
- Method
- The R package immunedeconv (V2.0.4) (PMID: 31510660) was used to perform immune cell deconvolution using RNA expression data (TPM).
- Genes
-
- ACAP1
- ADSL
- AK1
- ANAPC5
- ANKRD55
- APBB1
- ARHGAP15
- ARID5B
- BAG3
- BMPR1A
- CA5B
- CAMSAP1
- CBLL1
- CCR4
- CCR6
- CCR7
- CCR8
- CD2
- CD247
- CD28
- CD4
- CD40LG
- CD48
- CD5
- CD6
- CDC14A
- CDKN2AIP
- CNIH4
- COL5A3
- CORO7
- CRY2
- CSNK1D
- CTLA4
- DAB1
- DDX24
- DHX16
- DIDO1
- DLEC1
- DNAI2
- DNAJB1
- DNMT1
- DVL1
- EDC4
- EIF2B5
- ERN1
- EXOC1
- FAM193B
- FASTK
- FBXL8
- FXYD7
- GGA3
- GMEB2
- GOLGB1
- GP5
- GPR15
- GPR25
- HNRNPUL1
- HUWE1
- ICOS
- IDUA
- IKZF1
- IL2RA
- INPP5E
- IPCEF1
- ITGB1BP1
- ITIH4
- ITK
- JOSD1
- KALRN
- KBTBD2
- KBTBD4
- KDM3A
- KRT1
- LTA
- LY9
- MAN2C1
- MCF2L2
- MORC2
- MSL3
- MTO1
- MYO16
- NAP1L4
- NCDN
- NCK2
- NDRG3
- NFRKB
- NME6
- NPAT
- NR2C1
- NUP85
- NXF1
- OBSCN
- OLAH
- PCDHGA9
- PIGG
- PLCG1
- PLCH2
- PLCL1
- PLXDC1
- PNMA3
- POLR2A
- POU6F1
- PSD
- PSMD2
- PURA
- RAD9A
- RAE1
- RBM5
- RPL38
- RPS16
- RPS21
- RRS1
- SARDH
- SCNN1D
- SGSM2
- SIRPG
- SLAMF1
- SLC4A5
- SMG5
- SNPH
- SNTG2
- SOCS3
- SORCS3
- SPEG
- SPTAN1
- STK11
- SUPT6H
- TAB2
- TCF20
- TCF25
- TFAP4
- THAP11
- TMEM30B
- TNFRSF4
- TNFSF8
- TOMM7
- TPO
- TPR
- TRADD
- TRAF3IP3
- TRAT1
- TRIM46
- TRMT61A
- TSC1
- UBASH3A
- UBQLN2
- USP10
- USP36
- USP39
- USP4
- WDR59
- WDR6
- XPC
- YLPM1
- ZC3HAV1
- ZFYVE9
- ZNF200
- ZNF638
- ZRSR2
- ZXDB
- More...
Gene association
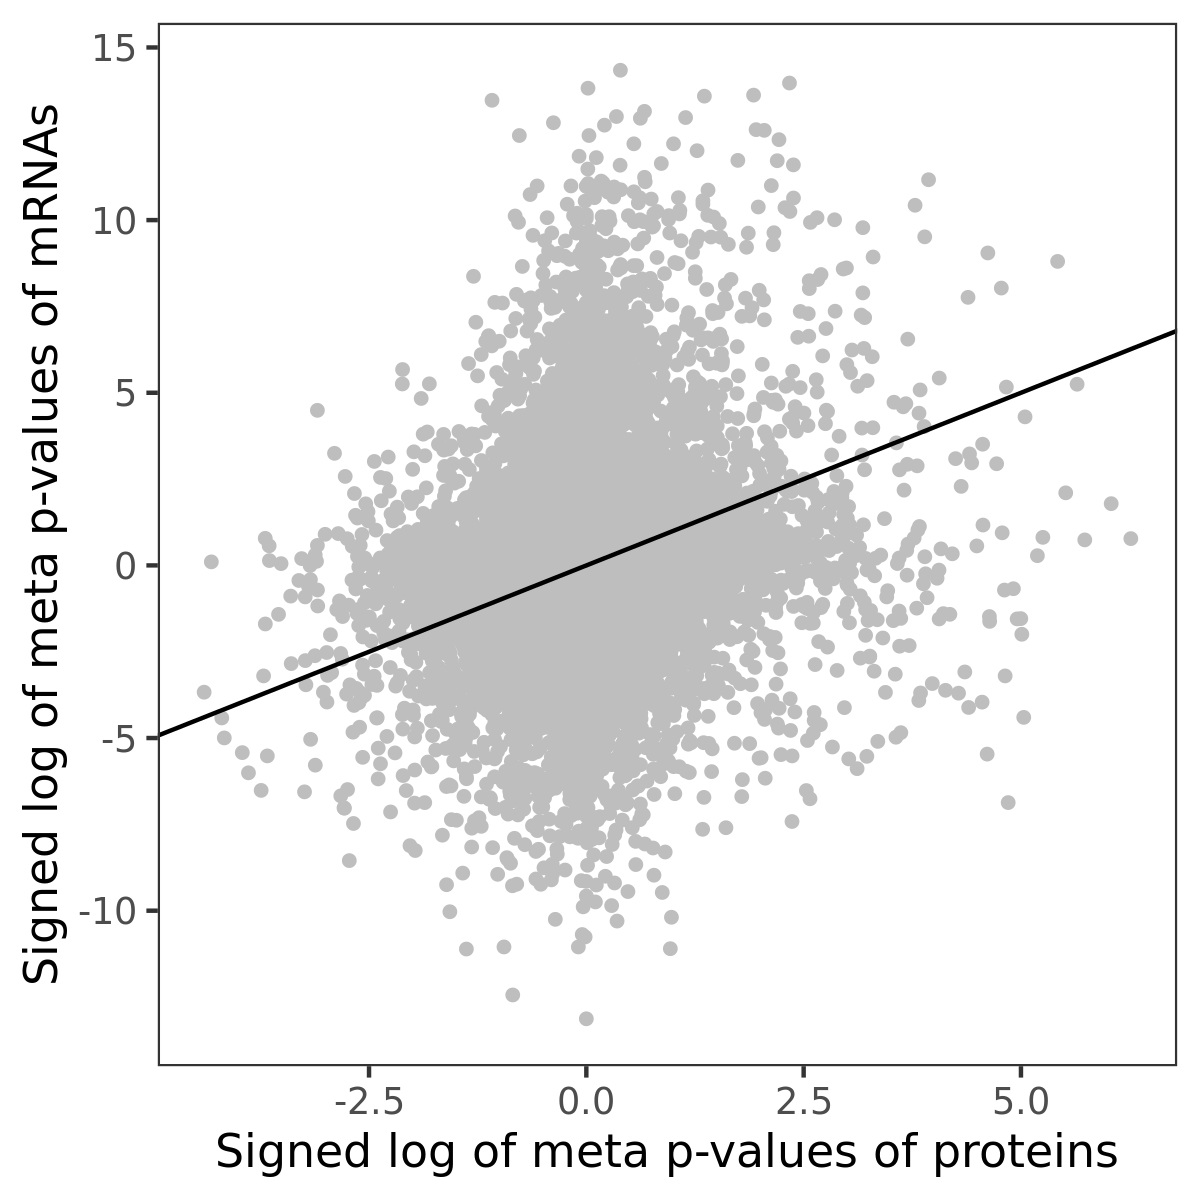
Number of significant genes with P-value ≤ 10-6 for each cohorts are summarized in bar plots. The scatter plot highlights significant associations diven by protein rather than mRNA abundance.
Association of protein abundance of genes
| Signed p-values | |||||||||||
|---|---|---|---|---|---|---|---|---|---|---|---|
| Gene | Meta P | BRCA | CCRCC | COAD | GBM | HNSCC | LSCC | LUAD | OV | PDAC | UCEC |
Gene set enrichment analysis
Submit genes and the common logarithm of the p-values of their association with xcell: T cell CD4+ central memory to WebGestalt.
Phosphosite association
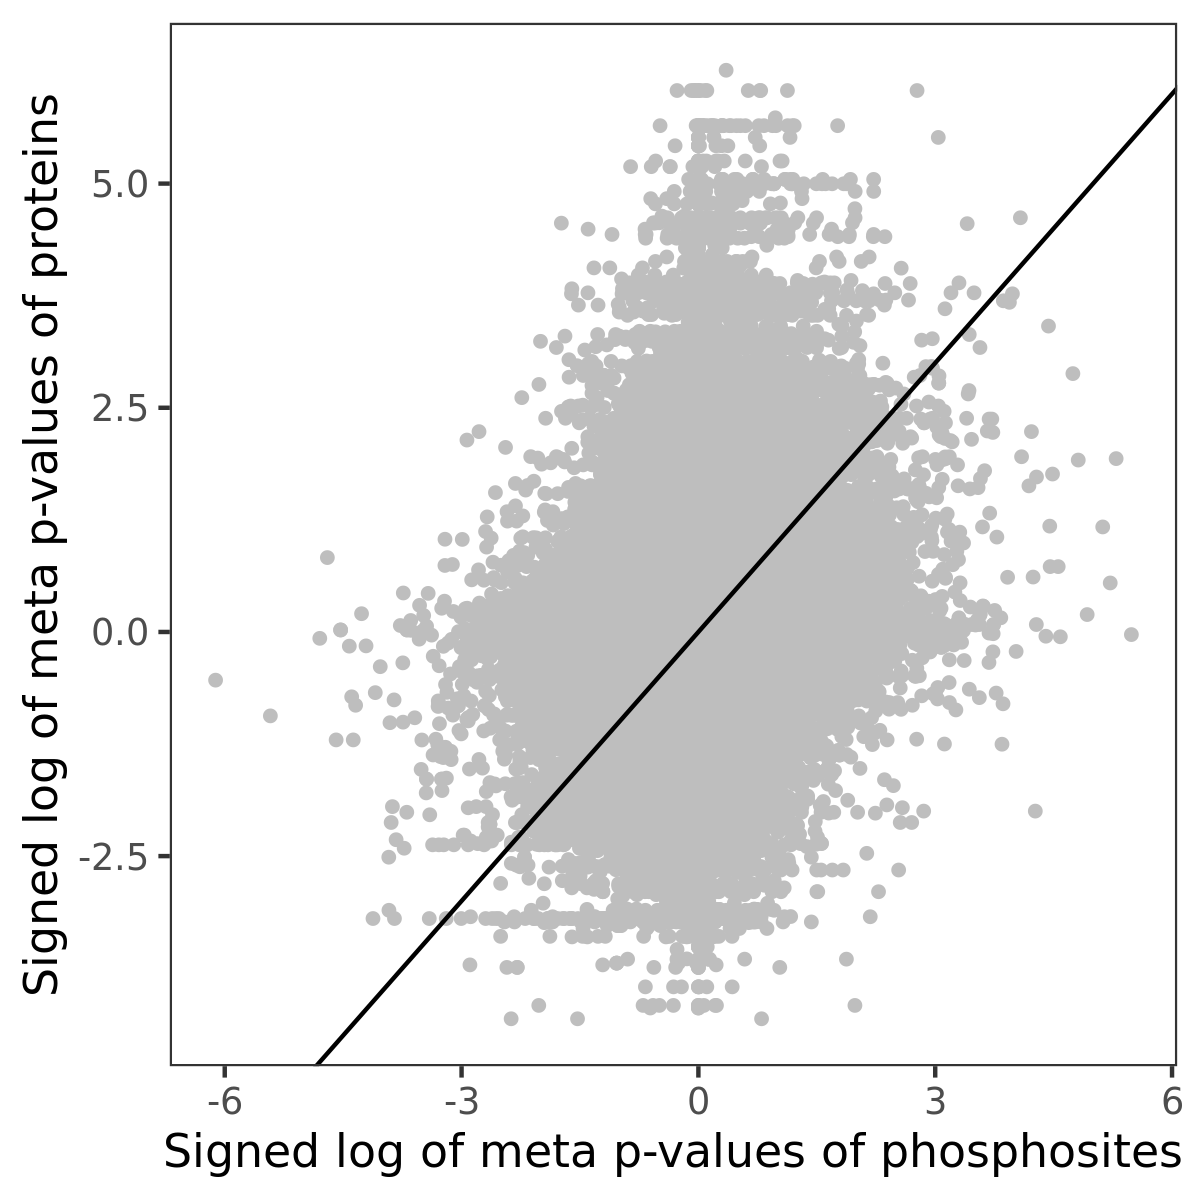
Number of significant genes with P-value ≤ 10-6 for each cohorts are summarized in the bar plot. The scatter plot highlights significant associations diven by phosphorylation rather than protein abundance.
| Signed p-values | |||||||||||||
|---|---|---|---|---|---|---|---|---|---|---|---|---|---|
| Gene | Protein | Site | Meta P | BRCA | CCRCC | COAD | GBM | HNSCC | LSCC | LUAD | OV | PDAC | UCEC |
Gene set enrichment analysis
Submit phosphorylation sites and the common logarithm of the p-values of their association with xcell: T cell CD4+ central memory to WebGestalt.