Basic information
- Phenotype
- ESTIMATE: StromalScore
- Description
- Score that represents the presence of stroma in a tumor sample. Calculated from RNA expression data using the ESTIMATE tool. The RNA data were filtered to genes with expression in at least 50% of the samples of a cohort.
- Source
- https://www.nature.com/articles/ncomms3612
- Method
- The ESTIMATE scores reflecting the overall immune and stromal infiltration were calculated by the R package ESTIMATE (PMID: 24113773) using the normalized RNA expression data (RSEM). We removed genes with 0 expression in >=50% samples of a cohort.
- Genes
-
- ACTG2
- ADAM12
- ADAMTS5
- ADGRA2
- AIF1
- AOC3
- APBB1IP
- ARHGAP28
- ASPN
- ATP8B4
- BGN
- BTK
- C1QA
- C1QB
- C3AR1
- CCN4
- CCR1
- CD14
- CD163
- CD200
- CD248
- CD33
- CD86
- CD93
- CDH5
- CH25H
- CILP
- CLEC7A
- COL10A1
- COL14A1
- COL15A1
- COL1A2
- COL3A1
- COL5A3
- COL6A3
- COL8A2
- COMP
- COX7A1
- CSF1R
- CXCL12
- CXCL14
- CXCL9
- DCN
- DDR2
- DIO2
- ECM2
- EDIL3
- EDNRA
- EGFL6
- EMCN
- ENPEP
- ENPP2
- ERG
- F13A1
- FAP
- FASLG
- FBLN2
- FCGR2A
- FCGR2B
- FMO1
- FOXF1
- FPR1
- FRZB
- GIMAP5
- GREM1
- HDC
- HEPH
- HGF
- IGF1
- IGSF6
- IL18R1
- IL1B
- ISLR
- ITGAM
- ITGBL1
- ITIH3
- ITIH5
- ITM2A
- KCNJ8
- KDR
- LDB2
- LMOD1
- LRRC15
- LRRC32
- LUM
- LY86
- MAF
- MFAP5
- MMP3
- MS4A4A
- MS4A6A
- MSR1
- MXRA5
- NME8
- NOX4
- OLFML1
- OLFML2B
- PAPPA
- PCDH12
- PDE2A
- PDGFRB
- PIK3R5
- PLPPR4
- PLXDC1
- PLXNC1
- PRKG1
- PTGER3
- PTGIS
- RAMP3
- RARRES2
- RASGRP3
- RGS4
- RSAD2
- RUNX1T1
- SAMSN1
- SCUBE2
- SERPING1
- SFRP4
- SGCD
- SH2D1A
- SIGLEC1
- SP140
- SPON1
- SPON2
- SULF1
- TCF21
- TENM4
- TFEC
- THBS2
- TLR2
- TLR7
- TNFSF4
- TNN
- TRAT1
- VCAM1
- VSIG4
- WNT2
- ZEB2
- ZFPM2
- ZNF423
- More...
Gene association
Number of significant genes with P-value ≤ 10-6 for each cohorts are summarized in bar plots. The scatter plot highlights significant associations diven by protein rather than mRNA abundance.
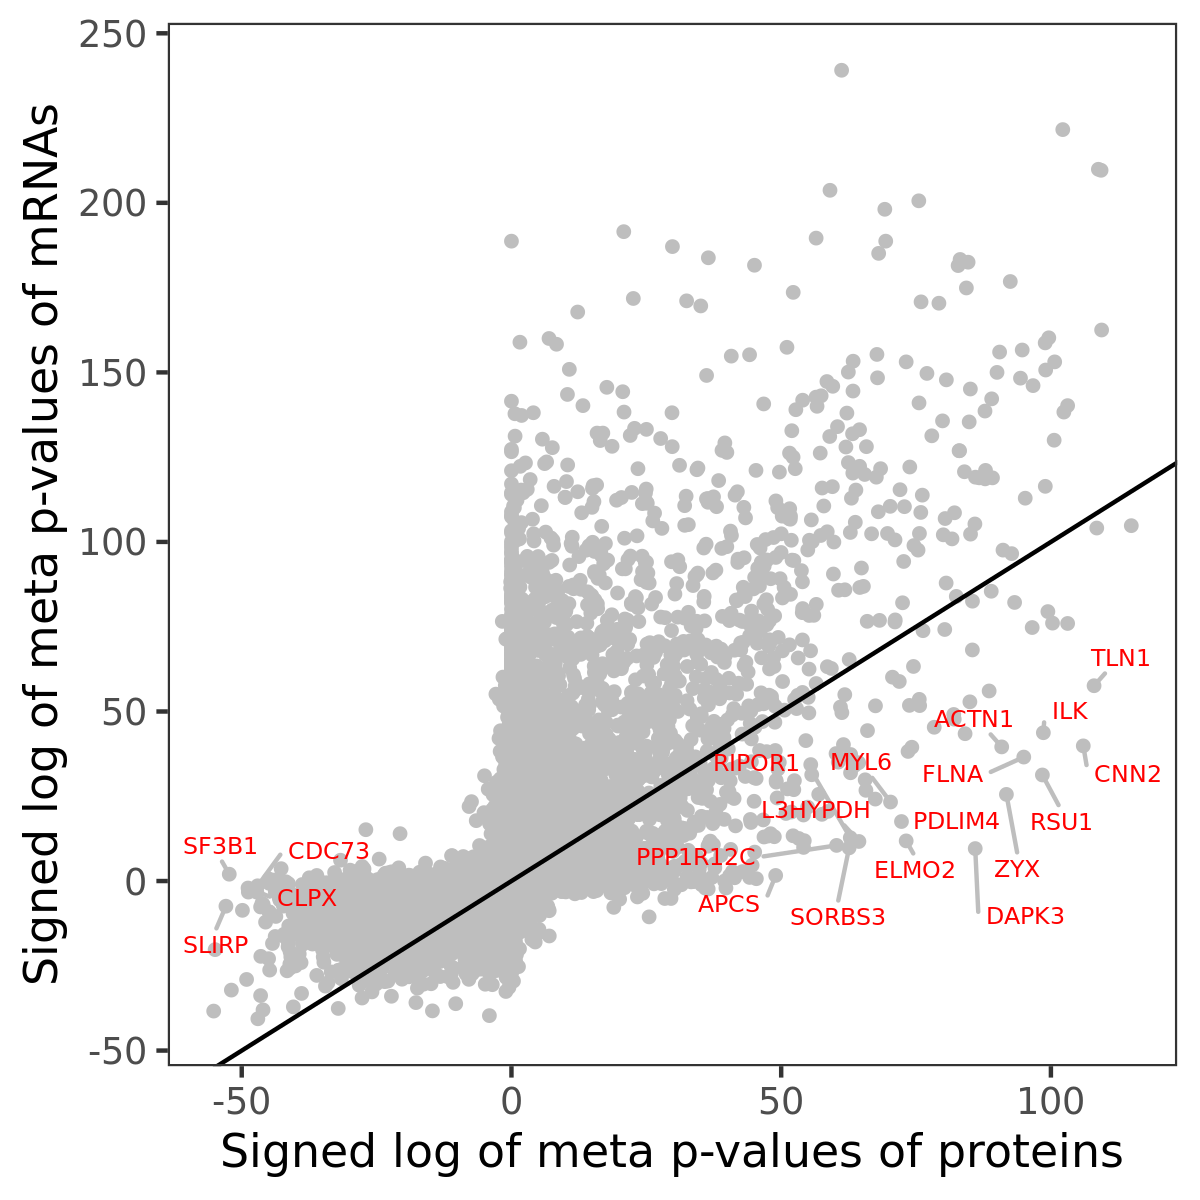
Association of protein abundance of genes
| Signed p-values | |||||||||||
|---|---|---|---|---|---|---|---|---|---|---|---|
| Gene | Meta P | BRCA | CCRCC | COAD | GBM | HNSCC | LSCC | LUAD | OV | PDAC | UCEC |
Gene set enrichment analysis
Submit genes and the common logarithm of the p-values of their association with ESTIMATE: StromalScore to WebGestalt.
Phosphosite association
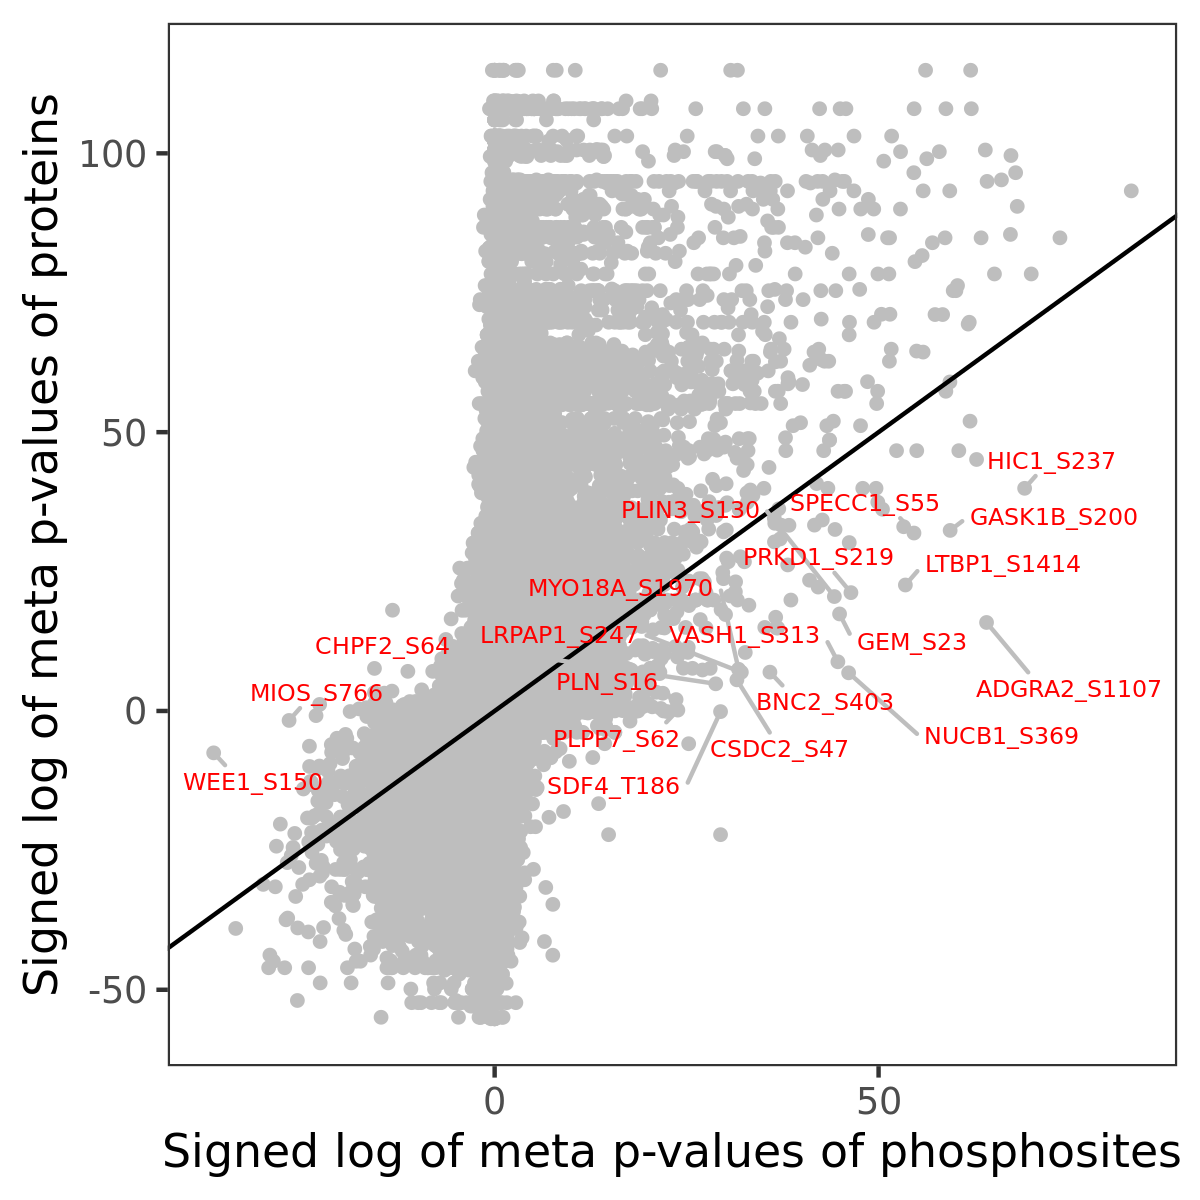
Number of significant genes with P-value ≤ 10-6 for each cohorts are summarized in the bar plot. The scatter plot highlights significant associations diven by phosphorylation rather than protein abundance.
| Signed p-values | |||||||||||||
|---|---|---|---|---|---|---|---|---|---|---|---|---|---|
| Gene | Protein | Site | Meta P | BRCA | CCRCC | COAD | GBM | HNSCC | LSCC | LUAD | OV | PDAC | UCEC |
Gene set enrichment analysis
Submit phosphorylation sites and the common logarithm of the p-values of their association with ESTIMATE: StromalScore to WebGestalt.