Basic information
- Phenotype
- HALLMARK_ANDROGEN_RESPONSE
- Description
- Enrichment score representing the response to androgen. The score was calculated using ssGSEA on the RNA data (Z-score transformed coding genes with expression in at least 50% of the samples in a cohort).
- Source
- http://www.gsea-msigdb.org/gsea/msigdb/cards/HALLMARK_ANDROGEN_RESPONSE.html
- Method
- Single sample gene set enrichment analysis (ssGSEA) was performed for each cancer type using gene-wise Z-scores of the RNA expression data (RSEM) for the MSigDB Hallmark gene sets v7.0 (PMID: 26771021) via the ssGSEA2.0 R package (PMID: 30563849). RNA data were filtered to coding genes with < 50% 0 expression. (Parameters: sample.norm.type="rank", weight=0.75, statistic="area.under.RES", nperm=1000, min.overlap=10). Pathway activity scores are normalized enrichment scores from ssGSEA.
- Genes
-
- ABHD2
- ACSL3
- ACTN1
- ADRM1
- AKT1
- Array
- ADAMTS1
- AKAP12
- ALDH1A3
- ANKH
- APPBP2
- ARID5B
- AZGP1
- B2M
- B4GALT1
- BMPR1B
- CAMKK2
- CCND1
- CCND3
- CDC14B
- CDK6
- CENPN
- DBI
- DHCR24
- DNAJB9
- ELK4
- ELL2
- ELOVL5
- FADS1
- FKBP5
- GNAI3
- GPD1L
- GSR
- GUCY1A1
- H1-0
- HERC3
- HMGCR
- HMGCS1
- HOMER2
- HPGD
- HSD17B14
- IDI1
- INPP4B
- INSIG1
- IQGAP2
- ITGAV
- KLK2
- KLK3
- KRT19
- KRT8
- LIFR
- LMAN1
- MAF
- MAK
- MAP7
- MERTK
- MYL12A
- NCOA4
- NDRG1
- NGLY1
- NKX3-1
- PA2G4
- PDLIM5
- PGM3
- PIAS1
- PLPP1
- PMEPA1
- PTK2B
- RAB4A
- RPS6KA3
- RRP12
- SAT1
- SCD
- SEC24D
- SELENOP
- SGK1
- SLC26A2
- SLC38A2
- SMS
- SORD
- SPCS3
- SPDEF
- SRF
- SRP19
- STEAP4
- STK39
- TMEM50A
- TMPRSS2
- TNFAIP8
- TPD52
- TSC22D1
- UAP1
- UBE2I
- UBE2J1
- VAPA
- XRCC5
- XRCC6
- ZBTB10
- ZMIZ1
- More...
Gene association
Number of significant genes with P-value ≤ 10-6 for each cohorts are summarized in bar plots. The scatter plot highlights significant associations diven by protein rather than mRNA abundance.
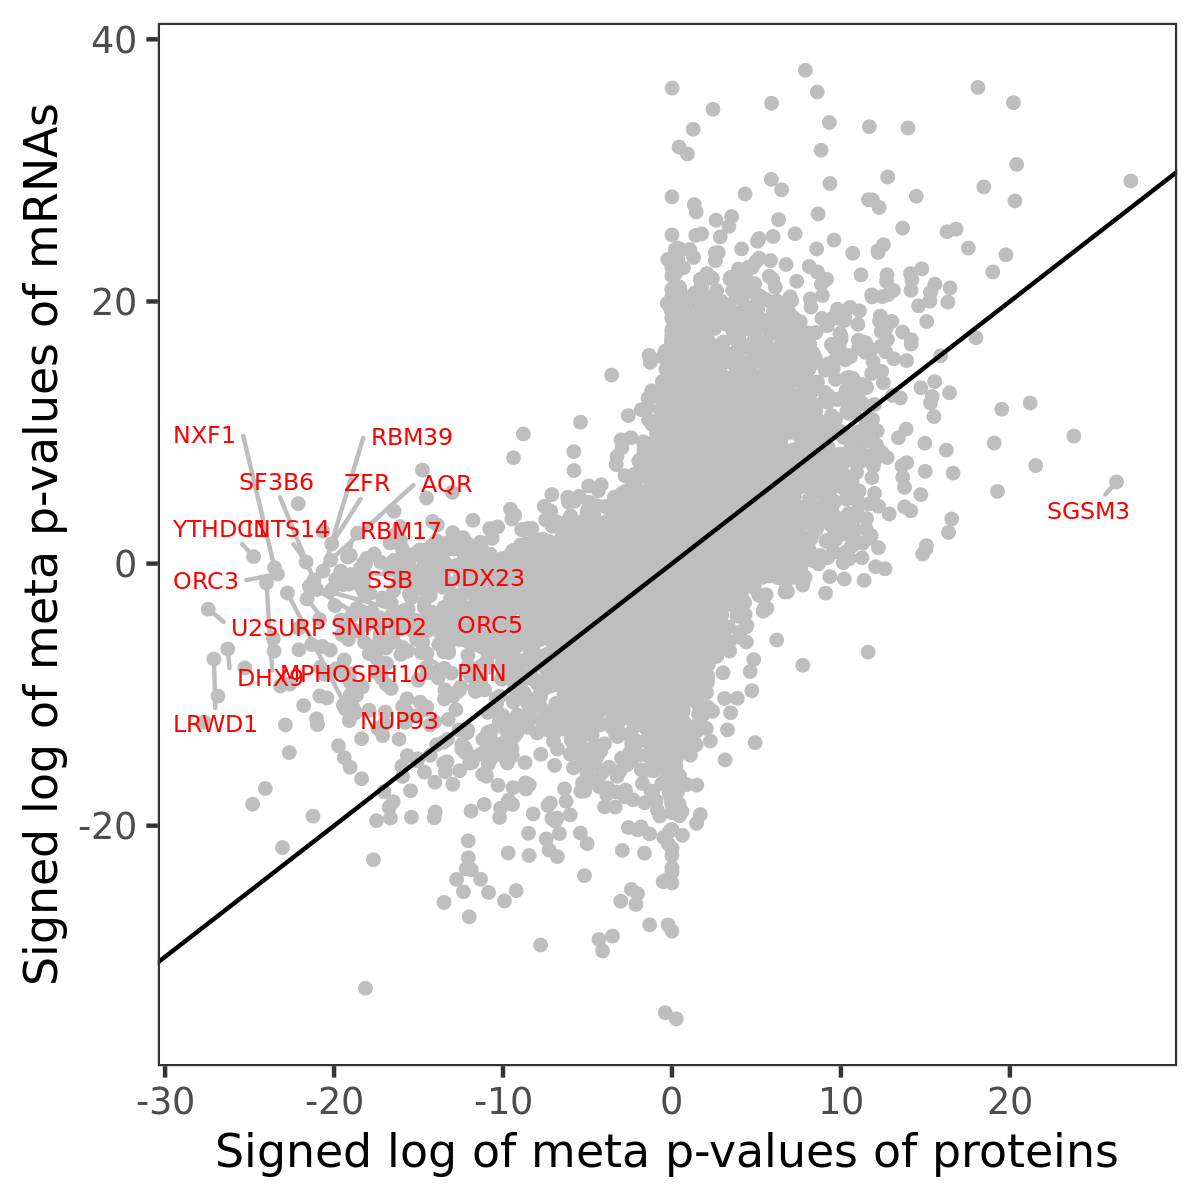
Association of protein abundance of genes
Signed p-values | ||||||||||||
|---|---|---|---|---|---|---|---|---|---|---|---|---|
Gene | Meta P | BRCA | CCRCC | COAD | GBM | HNSCC | LSCC | LUAD | OV | PDAC | UCEC | |
| No matching records found | ||||||||||||
Gene set enrichment analysis
Submit genes and the common logarithm of the p-values of their association with HALLMARK_ANDROGEN_RESPONSE to WebGestalt.
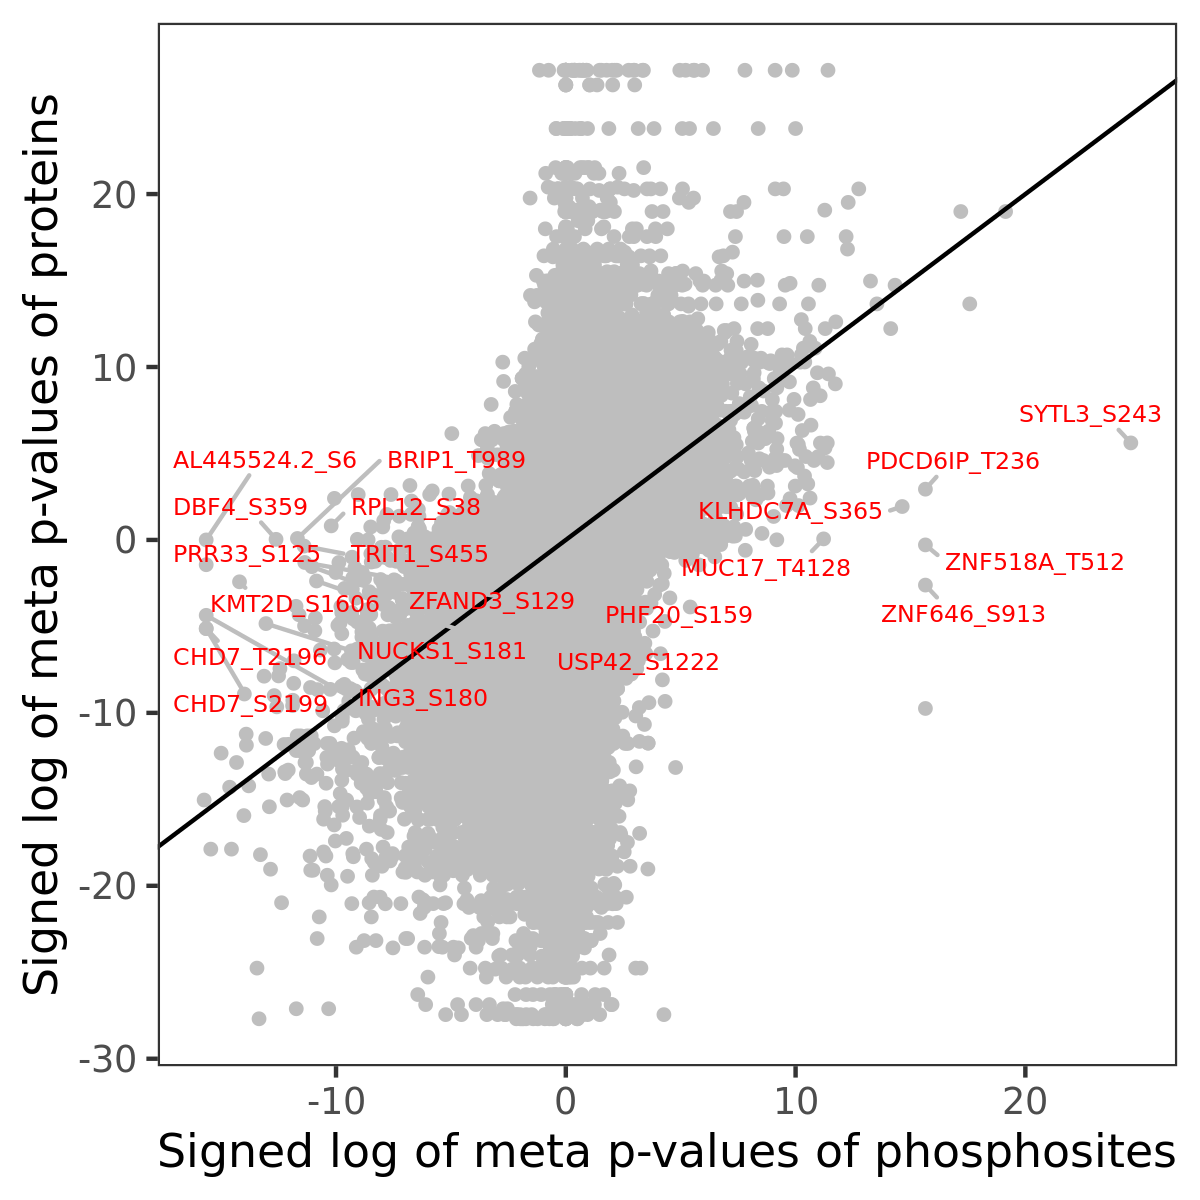
Phosphosite association
Number of significant genes with P-value ≤ 10-6 for each cohorts are summarized in the bar plot. The scatter plot highlights significant associations diven by phosphorylation rather than protein abundance.
Signed p-values | |||||||||||||
|---|---|---|---|---|---|---|---|---|---|---|---|---|---|
Gene | Protein | Site | Meta P | BRCA | CCRCC | COAD | GBM | HNSCC | LSCC | LUAD | OV | PDAC | UCEC |
| No matching records found | |||||||||||||
Gene set enrichment analysis
Submit phosphorylation sites and the common logarithm of the p-values of their association with HALLMARK_ANDROGEN_RESPONSE to WebGestalt.