Basic information
- Phenotype
- HALLMARK_DNA_REPAIR
- Description
- Enrichment score representing genes related to DNA repair. The score was calculated using ssGSEA on the RNA data (Z-score transformed coding genes with expression in at least 50% of the samples in a cohort).
- Source
- http://www.gsea-msigdb.org/gsea/msigdb/cards/HALLMARK_DNA_REPAIR.html
- Method
- Single sample gene set enrichment analysis (ssGSEA) was performed for each cancer type using gene-wise Z-scores of the RNA expression data (RSEM) for the MSigDB Hallmark gene sets v7.0 (PMID: 26771021) via the ssGSEA2.0 R package (PMID: 30563849). RNA data were filtered to coding genes with < 50% 0 expression. (Parameters: sample.norm.type="rank", weight=0.75, statistic="area.under.RES", nperm=1000, min.overlap=10). Pathway activity scores are normalized enrichment scores from ssGSEA.
- Genes
-
- ADA
- ADCY6
- ADRM1
- AGO4
- AK1
- AK3
- ALYREF
- APRT
- ARL6IP1
- BCAM
- BCAP31
- BOLA2
- BRF2
- CANT1
- CCNO
- CDA
- CETN2
- CLP1
- CMPK2
- COX17
- CSTF3
- DAD1
- DCTN4
- DDB1
- DDB2
- DGCR8
- DGUOK
- DUT
- EDF1
- EIF1B
- ELL
- ELOA
- ERCC1
- ERCC2
- ERCC3
- ERCC4
- ERCC5
- ERCC8
- FEN1
- GMPR2
- GPX4
- GSDME
- GTF2A2
- GTF2B
- GTF2F1
- GTF2H1
- GTF2H3
- GTF2H5
- GTF3C5
- GUK1
- HCLS1
- HPRT1
- IMPDH2
- ITPA
- LIG1
- MPC2
- MPG
- Array
- MRPL40
- NCBP2
- NELFB
- NELFCD
- NELFE
- NFX1
- NME1
- NME3
- NME4
- NPR2
- NT5C
- NT5C3A
- NUDT21
- NUDT9
- PCNA
- PDE4B
- PNP
- POLA1
- POLA2
- POLB
- POLD1
- POLD3
- POLD4
- POLE4
- POLH
- POLL
- POLR1C
- POLR1D
- POLR2A
- POLR2C
- POLR2D
- POLR2E
- POLR2F
- POLR2G
- POLR2H
- POLR2I
- POLR2J
- POLR2K
- POLR3C
- POLR3GL
- POM121
- PRIM1
- RAD51
- RAD52
- RAE1
- RALA
- RBX1
- REV3L
- RFC2
- RFC3
- RFC4
- RFC5
- RNMT
- RPA2
- RPA3
- RRM2B
- SAC3D1
- SDCBP
- SEC61A1
- SF3A3
- SMAD5
- SNAPC4
- SNAPC5
- SRSF6
- SSRP1
- STX3
- SUPT4H1
- SUPT5H
- SURF1
- TAF10
- TAF12
- TAF13
- TAF1C
- TAF6
- TAF9
- TARBP2
- TK2
- TMED2
- TP53
- TSG101
- TYMS
- UMPS
- UPF3B
- USP11
- VPS28
- VPS37B
- VPS37D
- XPC
- ZNF707
- ZNRD1
- ZWINT
- More...
Gene association
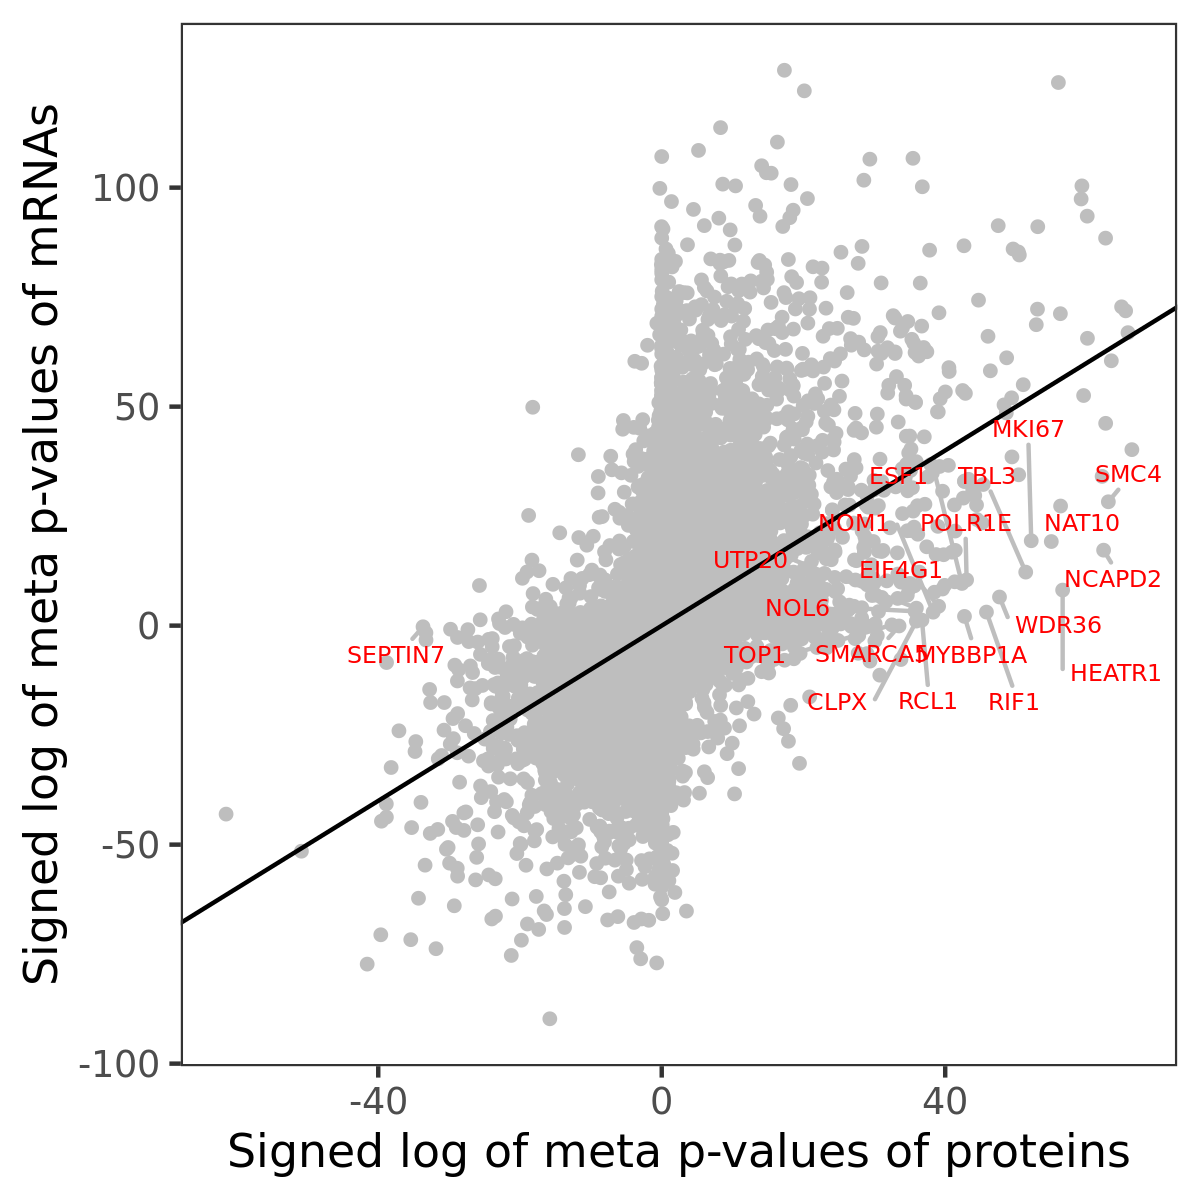
Number of significant genes with P-value ≤ 10-6 for each cohorts are summarized in bar plots. The scatter plot highlights significant associations diven by protein rather than mRNA abundance.

Association of protein abundance of genes
Signed p-values | ||||||||||||
|---|---|---|---|---|---|---|---|---|---|---|---|---|
Gene | Meta P | BRCA | CCRCC | COAD | GBM | HNSCC | LSCC | LUAD | OV | PDAC | UCEC | |
| No matching records found | ||||||||||||
Gene set enrichment analysis
Submit genes and the common logarithm of the p-values of their association with HALLMARK_DNA_REPAIR to WebGestalt.
Phosphosite association
Number of significant genes with P-value ≤ 10-6 for each cohorts are summarized in the bar plot. The scatter plot highlights significant associations diven by phosphorylation rather than protein abundance.

Signed p-values | |||||||||||||
|---|---|---|---|---|---|---|---|---|---|---|---|---|---|
Gene | Protein | Site | Meta P | BRCA | CCRCC | COAD | GBM | HNSCC | LSCC | LUAD | OV | PDAC | UCEC |
| No matching records found | |||||||||||||
Gene set enrichment analysis
Submit phosphorylation sites and the common logarithm of the p-values of their association with HALLMARK_DNA_REPAIR to WebGestalt.