Basic information
- Phenotype
- HALLMARK_HEDGEHOG_SIGNALING
- Description
- Enrichment score representing hedgehog signaling. The score was calculated using ssGSEA on the RNA data (Z-score transformed coding genes with expression in at least 50% of the samples in a cohort).
- Source
- http://www.gsea-msigdb.org/gsea/msigdb/cards/HALLMARK_HEDGEHOG_SIGNALING.html
- Method
- Single sample gene set enrichment analysis (ssGSEA) was performed for each cancer type using gene-wise Z-scores of the RNA expression data (RSEM) for the MSigDB Hallmark gene sets v7.0 (PMID: 26771021) via the ssGSEA2.0 R package (PMID: 30563849). RNA data were filtered to coding genes with < 50% 0 expression. (Parameters: sample.norm.type="rank", weight=0.75, statistic="area.under.RES", nperm=1000, min.overlap=10). Pathway activity scores are normalized enrichment scores from ssGSEA.
- Genes
Gene association
Number of significant genes with P-value ≤ 10-6 for each cohorts are summarized in bar plots. The scatter plot highlights significant associations diven by protein rather than mRNA abundance.
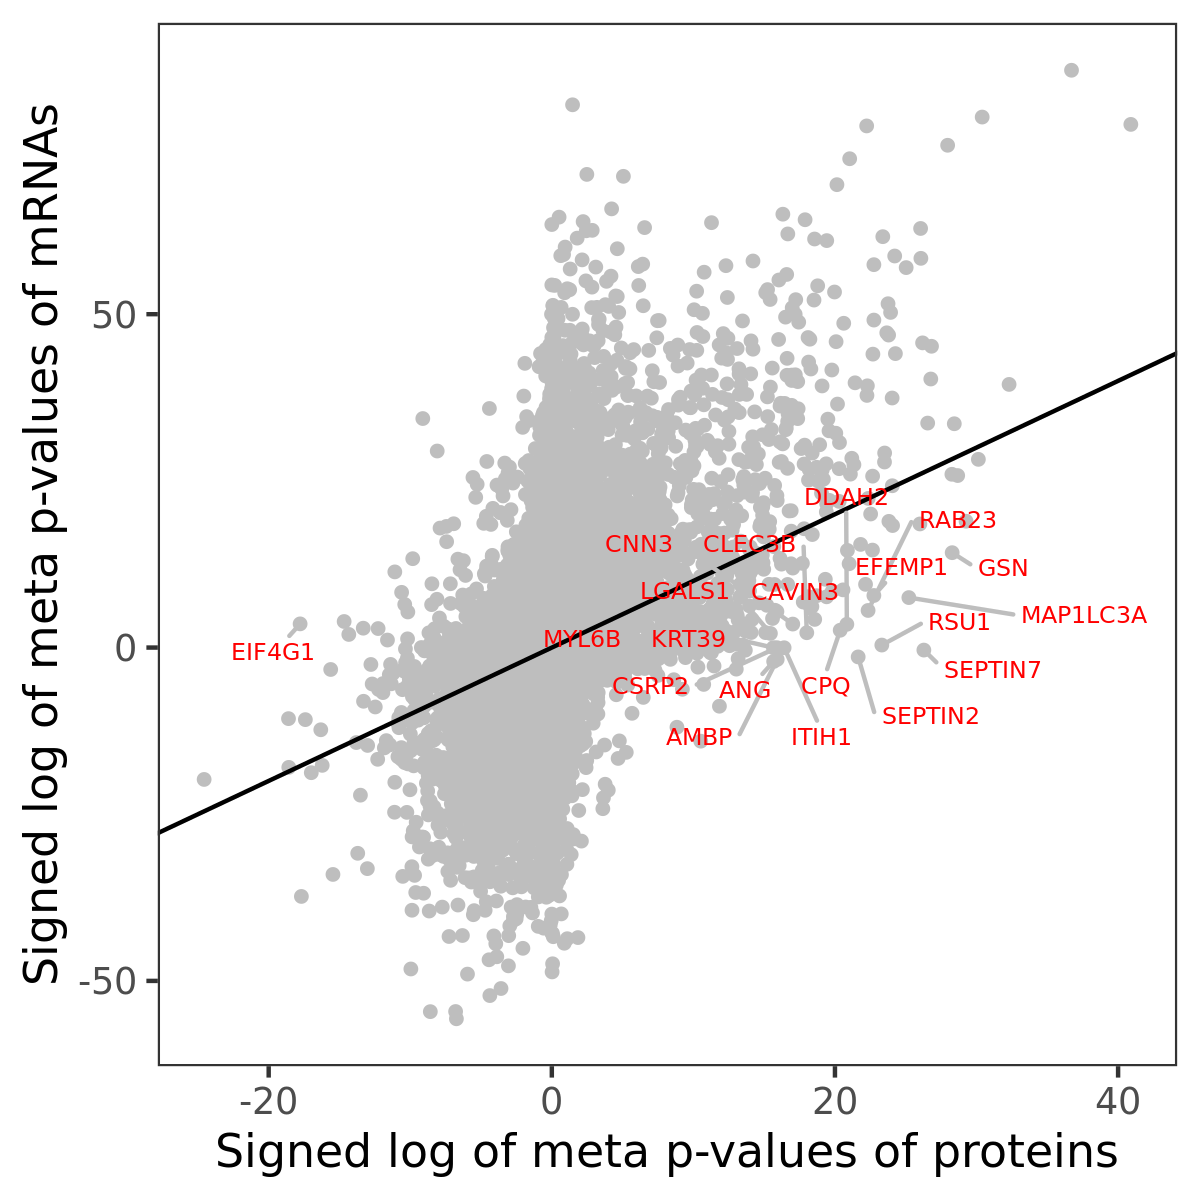
Association of protein abundance of genes
| Signed p-values | |||||||||||
|---|---|---|---|---|---|---|---|---|---|---|---|
| Gene | Meta P | BRCA | CCRCC | COAD | GBM | HNSCC | LSCC | LUAD | OV | PDAC | UCEC |
Gene set enrichment analysis
Submit genes and the common logarithm of the p-values of their association with HALLMARK_HEDGEHOG_SIGNALING to WebGestalt.
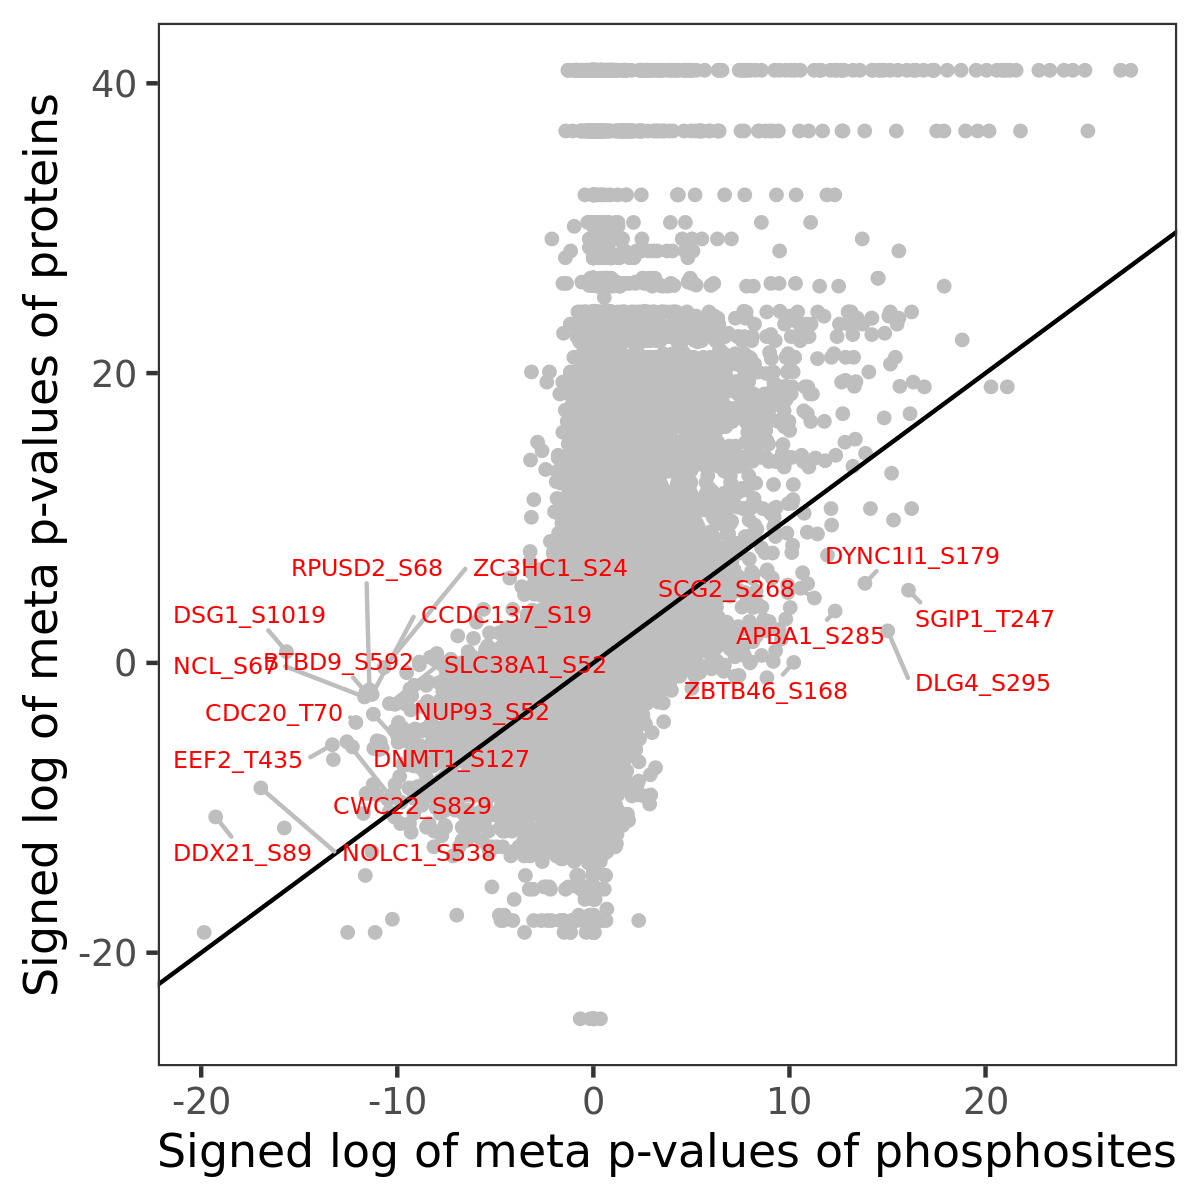
Phosphosite association
Number of significant genes with P-value ≤ 10-6 for each cohorts are summarized in the bar plot. The scatter plot highlights significant associations diven by phosphorylation rather than protein abundance.
| Signed p-values | |||||||||||||
|---|---|---|---|---|---|---|---|---|---|---|---|---|---|
| Gene | Protein | Site | Meta P | BRCA | CCRCC | COAD | GBM | HNSCC | LSCC | LUAD | OV | PDAC | UCEC |
Gene set enrichment analysis
Submit phosphorylation sites and the common logarithm of the p-values of their association with HALLMARK_HEDGEHOG_SIGNALING to WebGestalt.