Basic information
- Phenotype
- HALLMARK_HEME_METABOLISM
- Description
- Enrichment score representing the genes involved in heme metabolism. The score was calculated using ssGSEA on the RNA data (Z-score transformed coding genes with expression in at least 50% of the samples in a cohort).
- Source
- http://www.gsea-msigdb.org/gsea/msigdb/cards/HALLMARK_HEME_METABOLISM.html
- Method
- Single sample gene set enrichment analysis (ssGSEA) was performed for each cancer type using gene-wise Z-scores of the RNA expression data (RSEM) for the MSigDB Hallmark gene sets v7.0 (PMID: 26771021) via the ssGSEA2.0 R package (PMID: 30563849). RNA data were filtered to coding genes with < 50% 0 expression. (Parameters: sample.norm.type="rank", weight=0.75, statistic="area.under.RES", nperm=1000, min.overlap=10). Pathway activity scores are normalized enrichment scores from ssGSEA.
- Genes
-
- Array
- ABCB6
- ABCG2
- ACKR1
- ACP5
- Array
- ACSL6
- ADD1
- ADD2
- ADIPOR1
- AGPAT4
- AHSP
- ALAD
- ALAS2
- ALDH1L1
- ALDH6A1
- ANK1
- AQP3
- ARHGEF12
- ARL2BP
- ASNS
- ATG4A
- ATP6V0A1
- BACH1
- BCAM
- BLVRA
- BLVRB
- BMP2K
- BNIP3L
- BPGM
- BSG
- BTG2
- BTRC
- C3
- CA1
- CA2
- CAST
- CAT
- CCDC28A
- CCND3
- CDC27
- CIR1
- CLCN3
- CLIC2
- CPOX
- CTNS
- CTSB
- CTSE
- DAAM1
- DCAF10
- DCAF11
- DCUN1D1
- DMTN
- E2F2
- EIF2AK1
- ELL2
- ENDOD1
- EPB41
- EPB42
- EPOR
- ERMAP
- EZH1
- FBXO34
- FBXO7
- FBXO9
- FECH
- FN3K
- FOXJ2
- FOXO3
- FTCD
- GAPVD1
- GATA1
- GCLC
- GCLM
- GDE1
- GLRX5
- GMPS
- GYPA
- GYPB
- GYPC
- GYPE
- H1-0
- H4C3
- HAGH
- HBB
- HBD
- HBQ1
- HBZ
- HDGF
- HEBP1
- HMBS
- HTATIP2
- HTRA2
- ICAM4
- IGSF3
- ISCA1
- KAT2B
- KDM7A
- KEL
- KHNYN
- KLF1
- KLF3
- LAMP2
- LMO2
- LPIN2
- LRP10
- MAP2K3
- MARCHF2
- MARCHF8
- MARK3
- MBOAT2
- MFHAS1
- MGST3
- MINPP1
- MKRN1
- MOCOS
- MOSPD1
- MPP1
- MXI1
- MYL4
- NARF
- NCOA4
- NEK7
- NFE2
- NFE2L1
- NNT
- NR3C1
- NUDT4
- Array
- OPTN
- OSBP2
- P4HA2
- PC
- PDZK1IP1
- PICALM
- PIGQ
- PPOX
- PPP2R5B
- PRDX2
- PSMD9
- RAD23A
- RANBP10
- RAP1GAP
- RBM38
- RBM5
- RCL1
- RHAG
- RHCE
- RHD
- RIOK3
- RNF123
- RNF19A
- SDCBP
- SEC14L1
- SELENBP1
- SIDT2
- SLC10A3
- SLC11A2
- SLC22A4
- SLC25A37
- SLC25A38
- SLC2A1
- SLC30A1
- SLC30A10
- SLC4A1
- SLC66A2
- SLC6A8
- SLC6A9
- SLC7A11
- SMOX
- SNCA
- SPTA1
- SPTB
- SYNJ1
- TAL1
- TCEA1
- TENT5C
- TFDP2
- TFRC
- TMCC2
- TMEM9B
- TNRC6B
- TNS1
- TOP1
- TRAK2
- TRIM10
- TRIM58
- TSPAN5
- TSPO2
- TYR
- UBAC1
- UCP2
- UROD
- UROS
- USP15
- VEZF1
- XK
- XPO7
- YPEL5
- More...
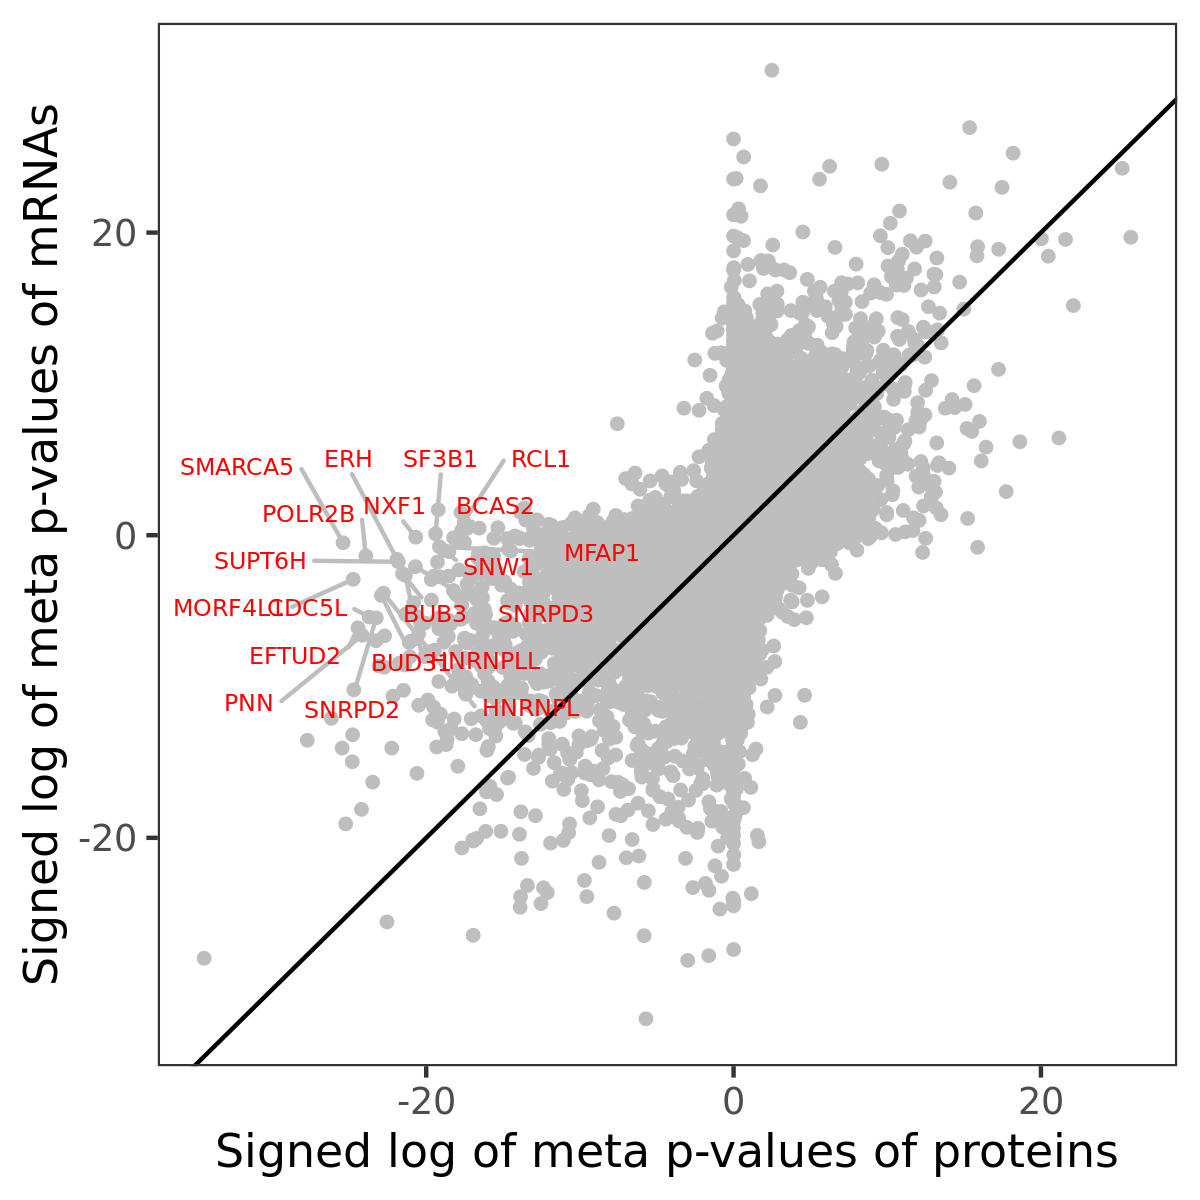
Gene association
Number of significant genes with P-value ≤ 10-6 for each cohorts are summarized in bar plots. The scatter plot highlights significant associations diven by protein rather than mRNA abundance.
Association of protein abundance of genes
Signed p-values | ||||||||||||
|---|---|---|---|---|---|---|---|---|---|---|---|---|
Gene | Meta P | BRCA | CCRCC | COAD | GBM | HNSCC | LSCC | LUAD | OV | PDAC | UCEC | |
| No matching records found | ||||||||||||
Gene set enrichment analysis
Submit genes and the common logarithm of the p-values of their association with HALLMARK_HEME_METABOLISM to WebGestalt.
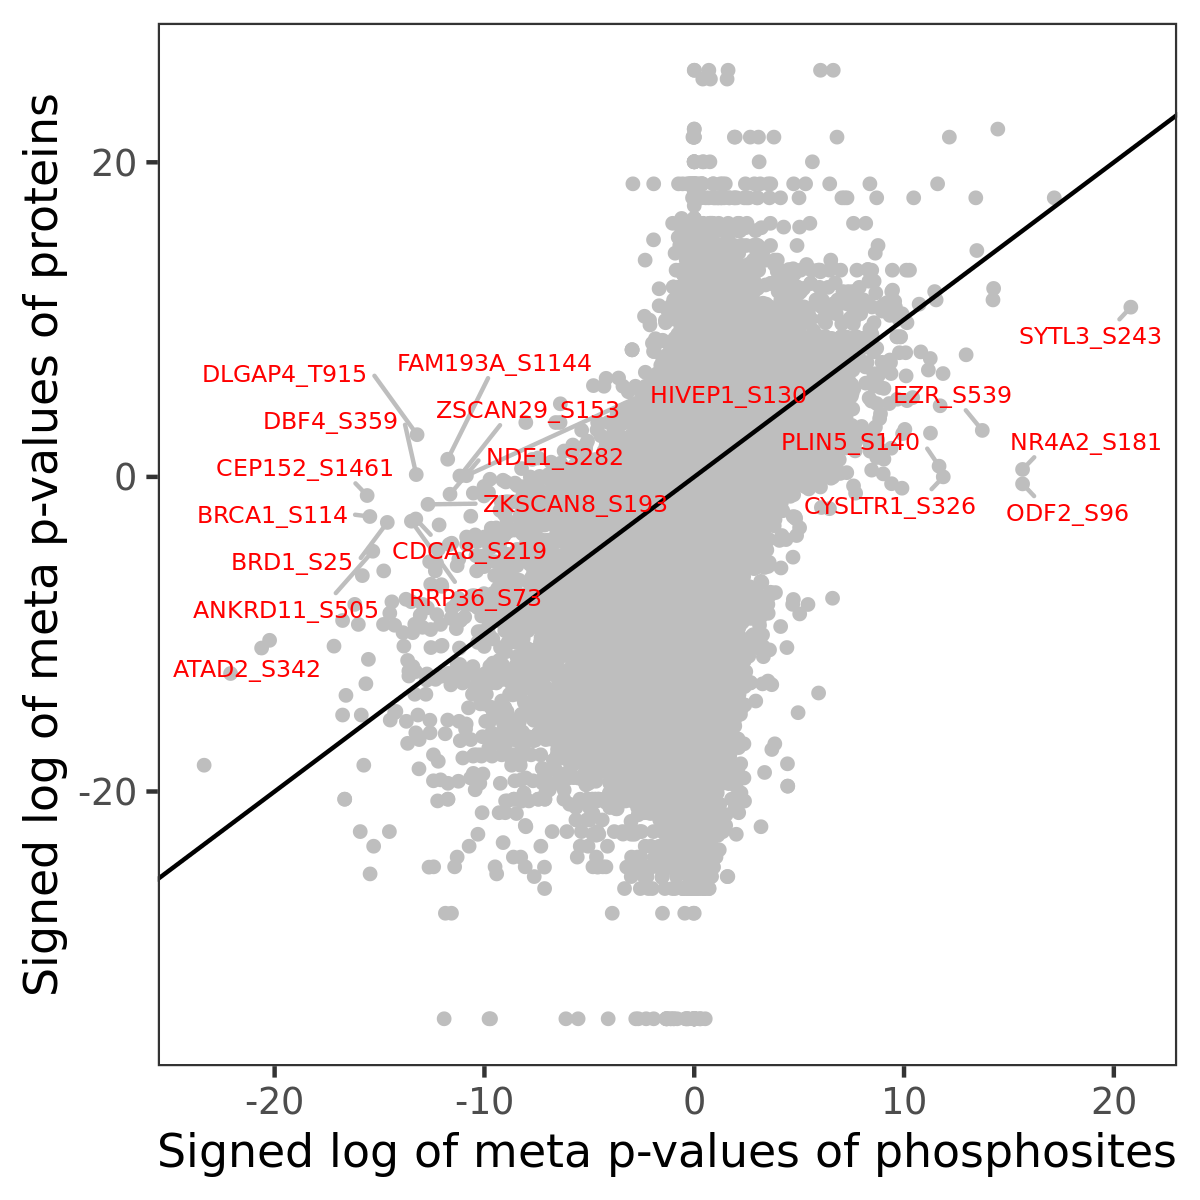
Phosphosite association
Number of significant genes with P-value ≤ 10-6 for each cohorts are summarized in the bar plot. The scatter plot highlights significant associations diven by phosphorylation rather than protein abundance.
Signed p-values | |||||||||||||
|---|---|---|---|---|---|---|---|---|---|---|---|---|---|
Gene | Protein | Site | Meta P | BRCA | CCRCC | COAD | GBM | HNSCC | LSCC | LUAD | OV | PDAC | UCEC |
| No matching records found | |||||||||||||
Gene set enrichment analysis
Submit phosphorylation sites and the common logarithm of the p-values of their association with HALLMARK_HEME_METABOLISM to WebGestalt.