Basic information
- Phenotype
- PROGENy: MAPK
- Description
- Score representing the activity of the MAPK pathway. It was calculated using the PROGENy tool on the RNA data (genes with mean FPKM expression >0).
- Source
- https://www.nature.com/articles/s41467-017-02391-6; https://www.sciencedirect.com/science/article/abs/pii/S1874939919302287?via%3Dihub
- Method
- The PROGENy scores were inferred using the R package progeny (V1.10.0) (PMID: 29295995) with default parameters using the RNA expression data (FPKM). Genes with mean expression = 0 in a cohort were removed from the analysis.
- Genes
-
- AREG
- ARHGEF17
- ASB8
- BDH2
- BRIX1
- BZW1
- C11orf71
- CBFB
- CCND1
- CDCA4
- DAZAP2
- DCBLD2
- DNASE2
- DUSP4
- DUSP5
- DUSP6
- DUSP7
- E2F3
- ECH1
- ELK3
- EPHA2
- ETV1
- ETV4
- ETV5
- FAM149B1
- FERMT1
- FMO5
- FOSL1
- GABARAP
- GATAD2A
- GPR3
- GRPEL1
- HMGA1
- HMGA2
- KIAA1522
- KMT5A
- KRR1
- LAMB2
- LDLR
- LRP8
- MAN2B2
- MCCC1
- MCL1
- MCMBP
- MGST3
- MIER2
- MPP6
- NNT
- NT5E
- NUP50
- PBLD
- PBX1
- PHC2
- PHLDA1
- PHLDA2
- PIK3C2B
- PNP
- POLR3G
- PRCP
- PRNP
- PWP2
- RAB26
- RAB5B
- RNF138
- SCPEP1
- SH3BGRL
- SIDT2
- SIRT2
- SLC20A1
- SLC35F2
- SLC4A7
- SLCO4A1
- SMURF2
- SPG11
- SPRED1
- SPRED2
- SPRY2
- SPRY4
- SRP14
- STK17A
- STX1A
- STX8
- TCOF1
- TMEM59
- TMUB2
- TNFRSF10A
- TNS3
- TOP1
- TRIB1
- TRIM52
- UBA2
- UBASH3B
- WDR3
- XRCC3
- YRDC
- ZBTB3
- ZSCAN31
- More...
Gene association
Number of significant genes with P-value ≤ 10-6 for each cohorts are summarized in bar plots. The scatter plot highlights significant associations diven by protein rather than mRNA abundance.
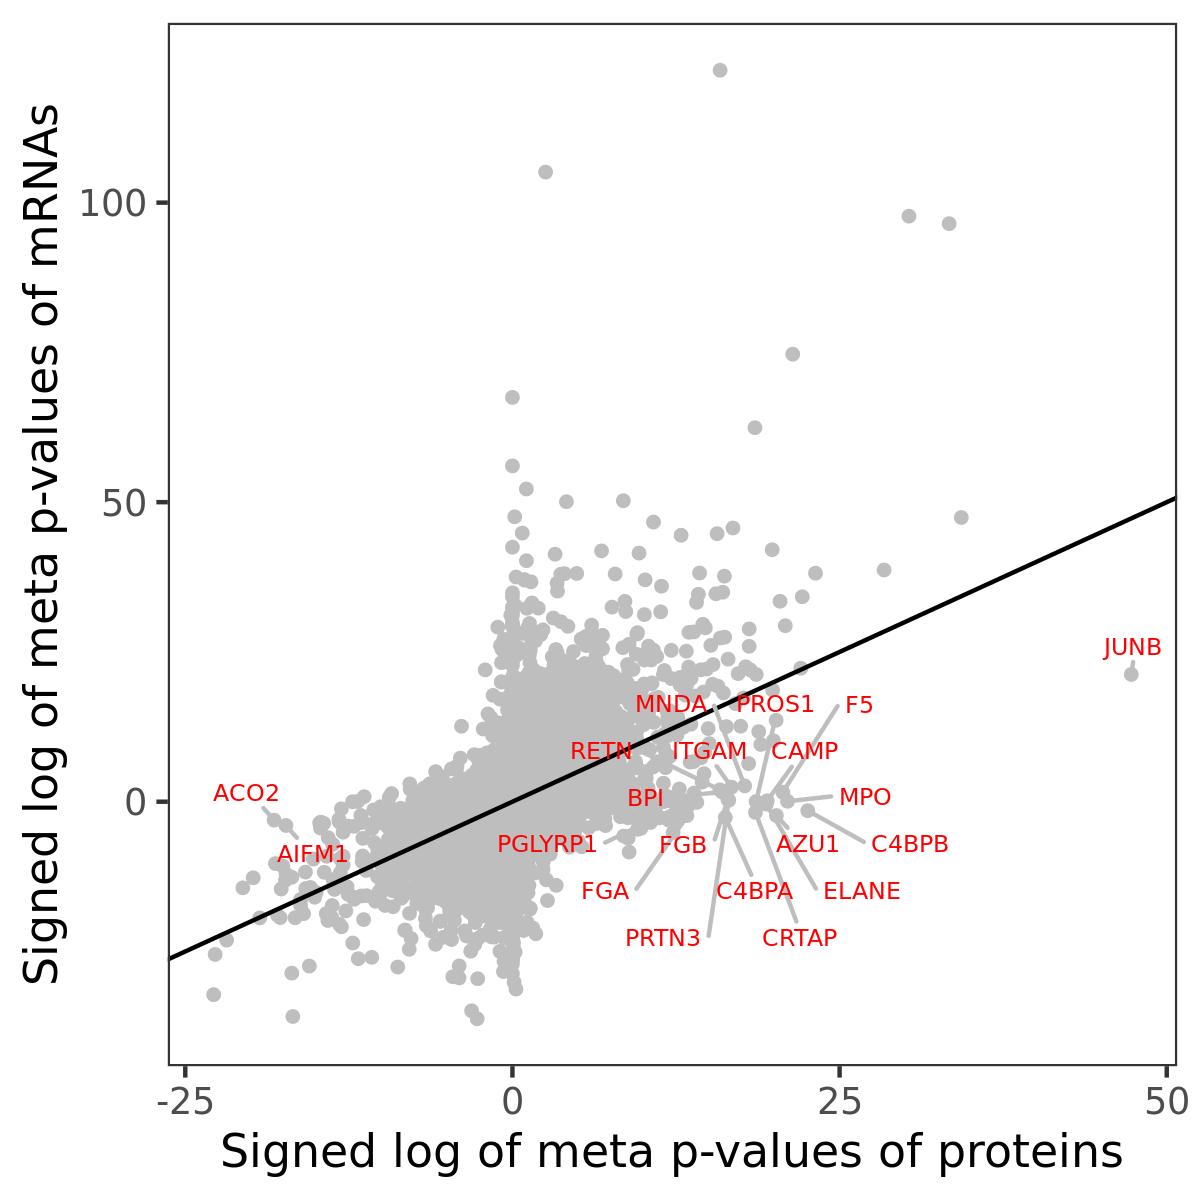
Association of protein abundance of genes
| Signed p-values | |||||||||||
|---|---|---|---|---|---|---|---|---|---|---|---|
| Gene | Meta P | BRCA | CCRCC | COAD | GBM | HNSCC | LSCC | LUAD | OV | PDAC | UCEC |
Gene set enrichment analysis
Submit genes and the common logarithm of the p-values of their association with PROGENy: MAPK to WebGestalt.
Phosphosite association
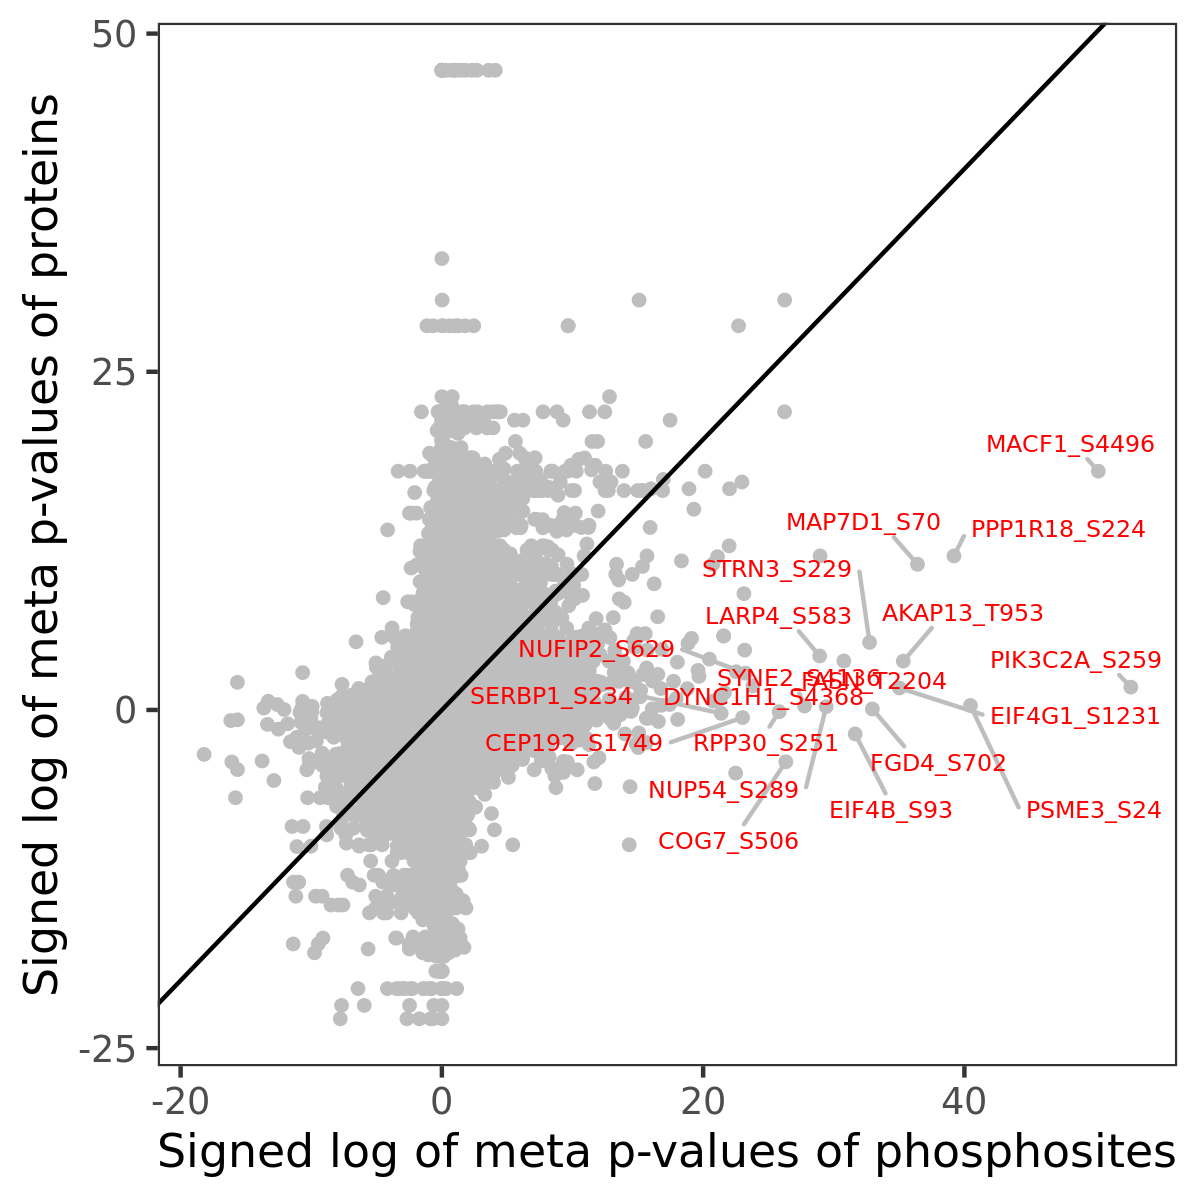
Number of significant genes with P-value ≤ 10-6 for each cohorts are summarized in the bar plot. The scatter plot highlights significant associations diven by phosphorylation rather than protein abundance.
| Signed p-values | |||||||||||||
|---|---|---|---|---|---|---|---|---|---|---|---|---|---|
| Gene | Protein | Site | Meta P | BRCA | CCRCC | COAD | GBM | HNSCC | LSCC | LUAD | OV | PDAC | UCEC |
Gene set enrichment analysis
Submit phosphorylation sites and the common logarithm of the p-values of their association with PROGENy: MAPK to WebGestalt.