Basic information
- Phenotype
- cibersort: Macrophage M0
- Description
- Estimated fraction of M0 macrophages in the tumor compared to 21 other immune cells defined by CIBERSORT based on RNA expression data.
- Source
- https://www.nature.com/articles/nmeth.3337
- Method
- The R package immunedeconv (V2.0.4) (PMID: 31510660) was used to perform immune cell deconvolution using RNA expression data (TPM). CIBERSORT (PMID: 25822800) was performed in the ‘abs’ mode.
- Genes
-
- ADAMDEC1
- AIF1
- ALOX5
- AQP9
- ARRB1
- BCL2A1
- BHLHE41
- BST1
- C1orf54
- C3AR1
- C5AR1
- CCL18
- CCL22
- CCL4
- CCL7
- CCND2
- CCR5
- CD300A
- CD33
- CD37
- CD4
- CD40
- CD68
- CD80
- CD86
- CDA
- CHI3L1
- CHST15
- CLEC4A
- CLEC7A
- CLIC2
- COL8A2
- CRTAM
- CSF1
- CXCL3
- CXCL5
- CYP27A1
- CYP27B1
- DCSTAMP
- DUSP2
- EGR2
- FCGR2B
- FCN1
- FLVCR2
- FPR1
- FPR3
- GPC4
- GPR183
- GPR65
- HCK
- HHEX
- HK3
- HLA-DQA1
- HNMT
- IDO1
- IGSF6
- IL1A
- IL1B
- IL4R
- IL7R
- IRF8
- KYNU
- LAT
- LILRA2
- LILRB2
- LST1
- LY86
- MAN1A1
- MARCO
- MMP9
- MNDA
- MSC
- NCF2
- NPL
- PLA2G7
- PPBP
- PTGER2
- QPCT
- RASGRP3
- RASSF4
- RENBP
- RNASE6
- SAMSN1
- SLAMF8
- SLC12A8
- SLC15A3
- SLC2A6
- ST3GAL6
- ST6GALNAC4
- TLR2
- TLR8
- TMEM255A
- TNFAIP6
- TNFSF14
- TPSAB1
- TREM1
- TREM2
- VNN1
- VNN2
- More...
Gene association
Number of significant genes with P-value ≤ 10-6 for each cohorts are summarized in bar plots. The scatter plot highlights significant associations diven by protein rather than mRNA abundance.
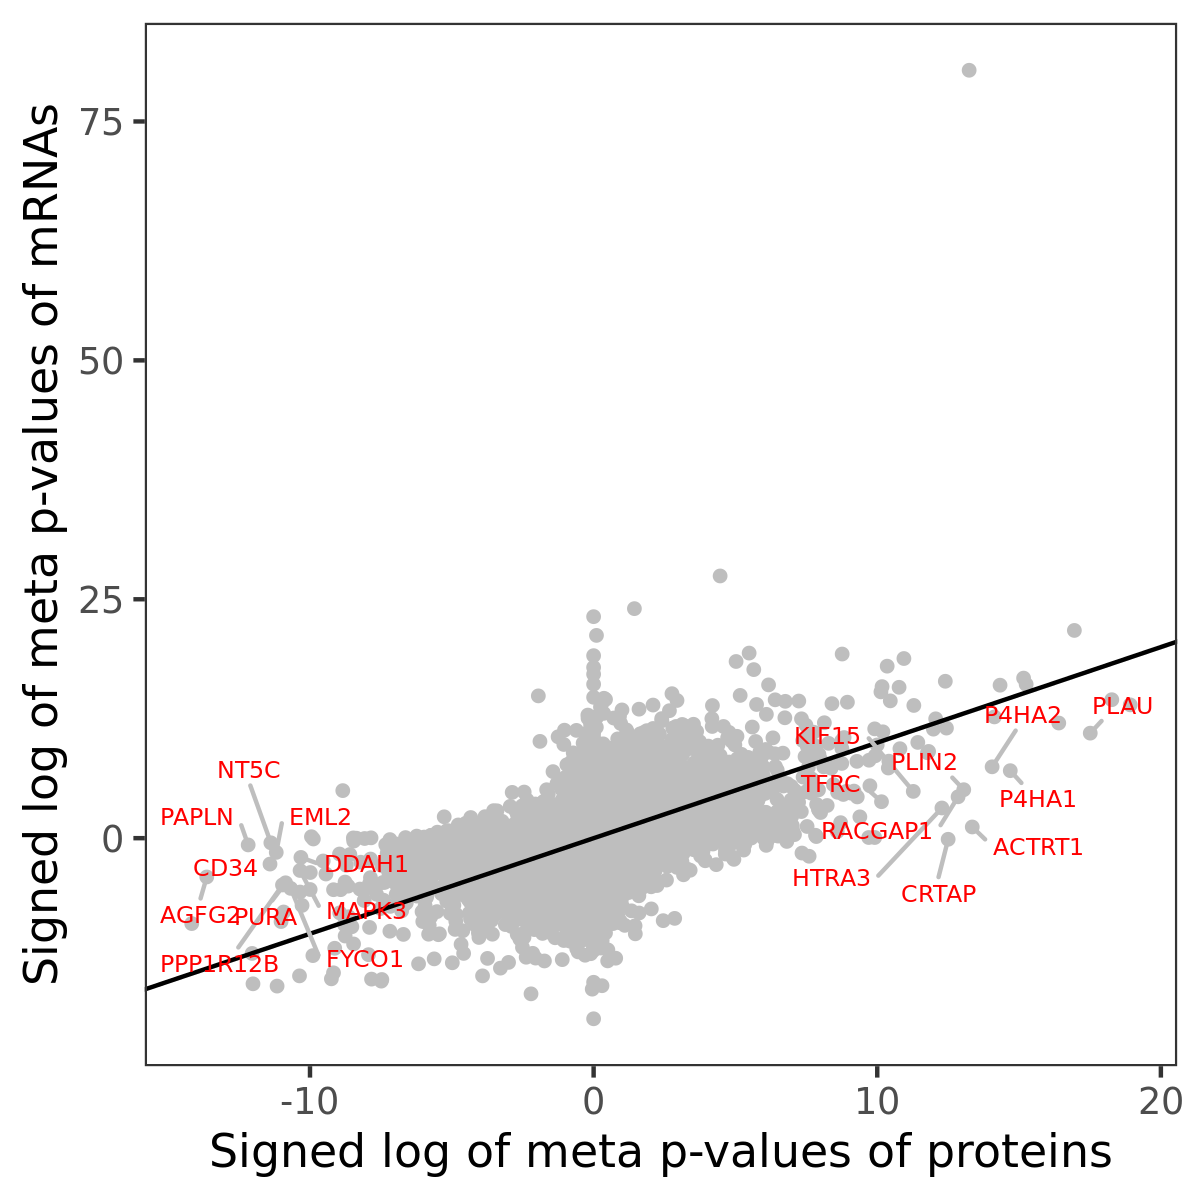
Association of protein abundance of genes
Signed p-values | ||||||||||||
|---|---|---|---|---|---|---|---|---|---|---|---|---|
Gene | Meta P | BRCA | CCRCC | COAD | GBM | HNSCC | LSCC | LUAD | OV | PDAC | UCEC | |
| No matching records found | ||||||||||||
Gene set enrichment analysis
Submit genes and the common logarithm of the p-values of their association with cibersort: Macrophage M0 to WebGestalt.
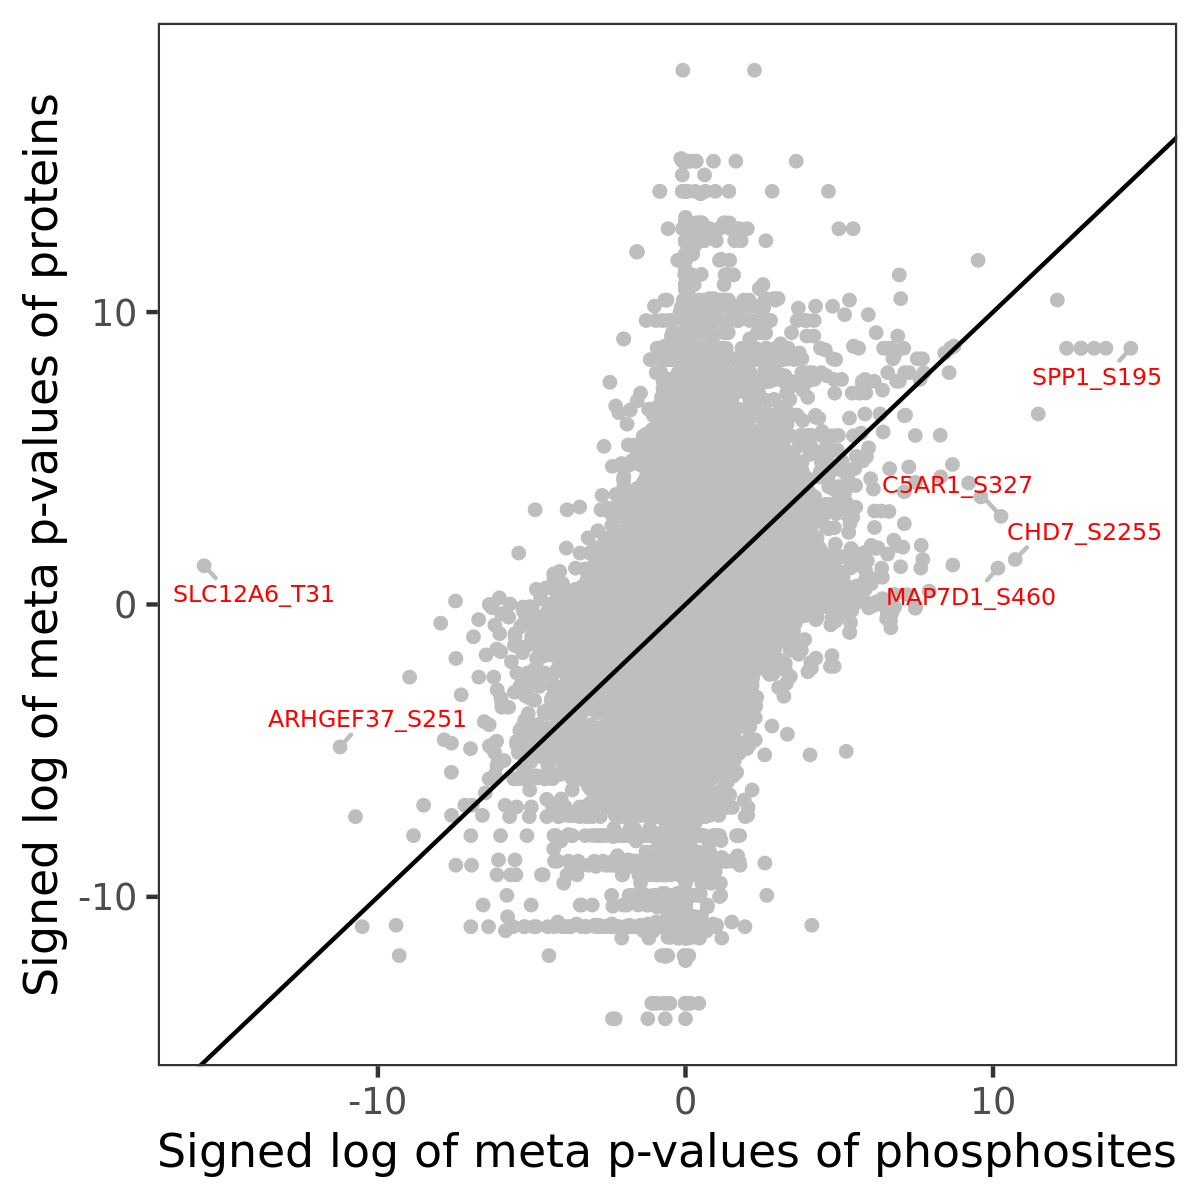
Phosphosite association
Number of significant genes with P-value ≤ 10-6 for each cohorts are summarized in the bar plot. The scatter plot highlights significant associations diven by phosphorylation rather than protein abundance.
Signed p-values | |||||||||||||
|---|---|---|---|---|---|---|---|---|---|---|---|---|---|
Gene | Protein | Site | Meta P | BRCA | CCRCC | COAD | GBM | HNSCC | LSCC | LUAD | OV | PDAC | UCEC |
| No matching records found | |||||||||||||
Gene set enrichment analysis
Submit phosphorylation sites and the common logarithm of the p-values of their association with cibersort: Macrophage M0 to WebGestalt.