Basic information
- Phenotype
- xcell: B cell naive
- Description
- Enrichment score inferring the proportion of naïve B cells in the tumor derived from RNA data using the xCell tool.
- Source
- https://genomebiology.biomedcentral.com/articles/10.1186/s13059-017-1349-1
- Method
- The R package immunedeconv (V2.0.4) (PMID: 31510660) was used to perform immune cell deconvolution using RNA expression data (TPM).
- Genes
-
- AKAP6
- AP3B1
- BCL2L10
- BCL2L11
- BLK
- BMP3
- CACNA1F
- CAPN3
- CCR6
- CD180
- CD19
- CD1A
- CD22
- CD37
- CD72
- CD79A
- CD79B
- CDK13
- CIITA
- COL19A1
- CSNK1G3
- CUBN
- CXCR5
- DAZL
- DEF8
- DSP
- FCER2
- FCRL2
- FRS2
- GCM1
- GGA2
- GH1
- GMFB
- GNG3
- GPR18
- HLA-DOA
- HSPA4
- KHDRBS2
- LY9
- MAP3K9
- MATN1
- MBD4
- MCM9
- MFN1
- MGAT5
- MMP17
- MS4A1
- MYBPC2
- MYO3A
- N4BP3
- NOC3L
- P2RY10
- PAX5
- PGAM2
- PHKG1
- PIKFYVE
- PNOC
- POU2F1
- PRDM2
- PRDM4
- PRKCB
- PTCH2
- PWP1
- PYGM
- RB1
- RBM15
- RERE
- RRAS2
- SIPA1L3
- SLC30A4
- SMC6
- Array
- Array
- SDK2
- SNTG2
- SNX2
- SP140
- SPIB
- STAG3
- STAP1
- SYN3
- TBC1D5
- TCL1A
- TCL1B
- TRA2B
- TRAPPC9
- TREML2
- TSPAN13
- UBE2O
- USP6
- USP7
- UTP6
- VPREB3
- WDR74
- ZNF154
- More...
Gene association
Number of significant genes with P-value ≤ 10-6 for each cohorts are summarized in bar plots. The scatter plot highlights significant associations diven by protein rather than mRNA abundance.
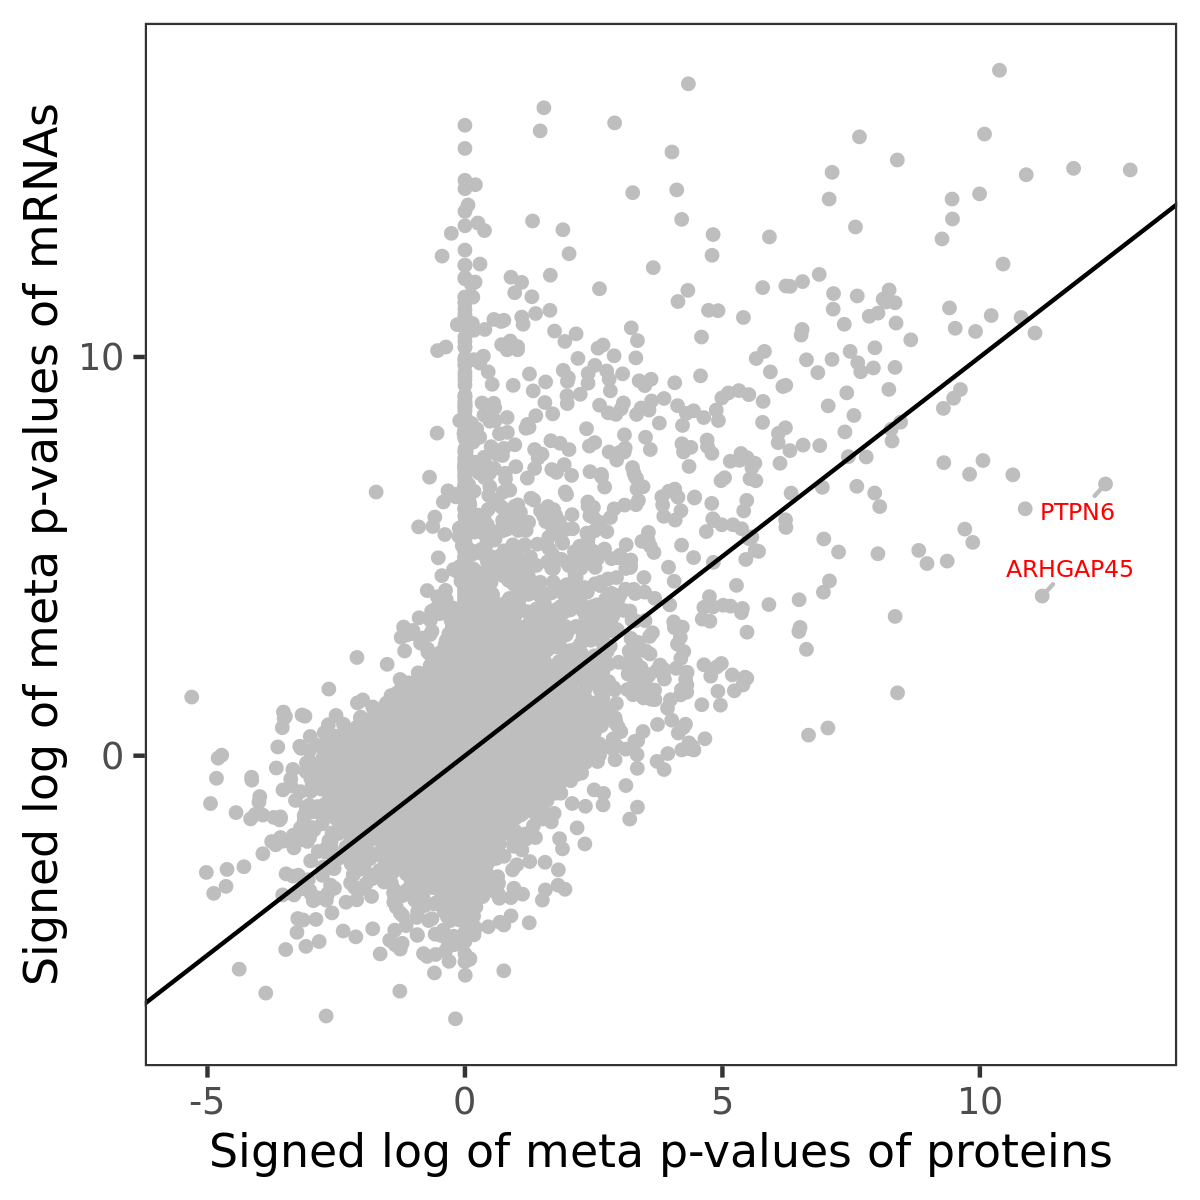
Association of protein abundance of genes
| Signed p-values | |||||||||||
|---|---|---|---|---|---|---|---|---|---|---|---|
| Gene | Meta P | BRCA | CCRCC | COAD | GBM | HNSCC | LSCC | LUAD | OV | PDAC | UCEC |
Gene set enrichment analysis
Submit genes and the common logarithm of the p-values of their association with xcell: B cell naive to WebGestalt.
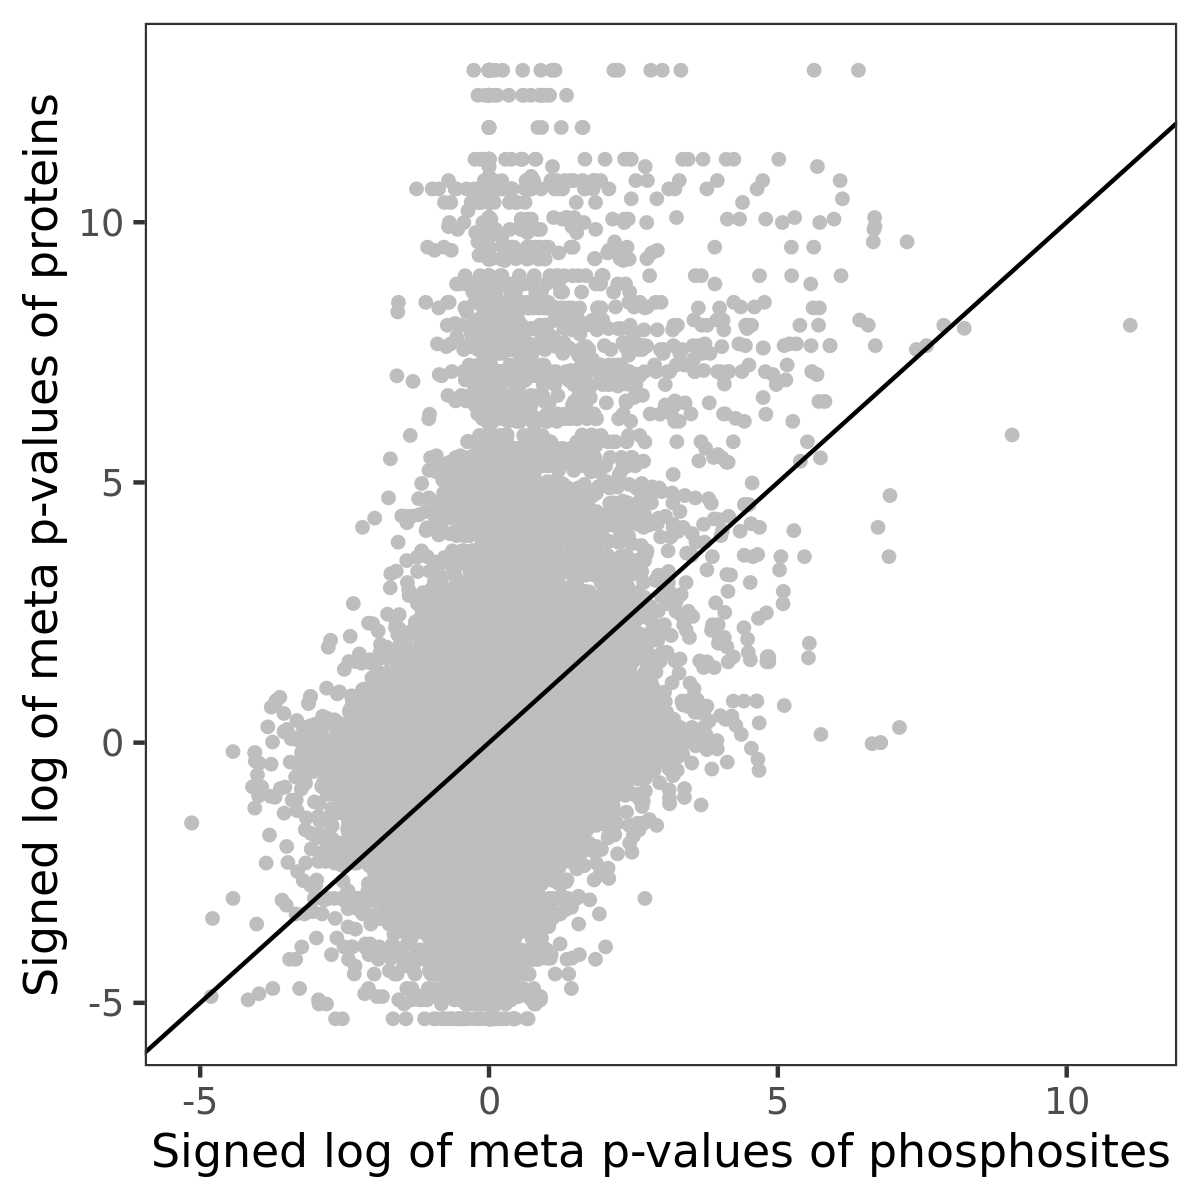
Phosphosite association
Number of significant genes with P-value ≤ 10-6 for each cohorts are summarized in the bar plot. The scatter plot highlights significant associations diven by phosphorylation rather than protein abundance.
| Signed p-values | |||||||||||||
|---|---|---|---|---|---|---|---|---|---|---|---|---|---|
| Gene | Protein | Site | Meta P | BRCA | CCRCC | COAD | GBM | HNSCC | LSCC | LUAD | OV | PDAC | UCEC |
Gene set enrichment analysis
Submit phosphorylation sites and the common logarithm of the p-values of their association with xcell: B cell naive to WebGestalt.