Basic information
- Phenotype
- xcell: Endothelial cell
- Description
- Enrichment score inferring the proportion of endothelial cells in the tumor derived from RNA data using the xCell tool.
- Source
- https://genomebiology.biomedcentral.com/articles/10.1186/s13059-017-1349-1
- Method
- The R package immunedeconv (V2.0.4) (PMID: 31510660) was used to perform immune cell deconvolution using RNA expression data (TPM).
- Genes
-
- ACVRL1
- ANGPT2
- ANO2
- ANXA2
- ANXA3
- AP2A2
- AP2S1
- ARHGEF15
- ARL2BP
- ARPC1A
- ART4
- ATF6
- BCL10
- BFAR
- BMX
- BTBD1
- BUB3
- CANX
- CARM1
- CAV1
- CCT6A
- CD9
- CD93
- CDC123
- CDC27
- CDC37
- CEP55
- CISD1
- CLDN5
- CLEC1A
- CLPP
- CLTA
- COPS6
- DAD1
- DCTN5
- DDX10
- DEF8
- DLGAP5
- DYNLL1
- ECD
- EDC3
- EDC4
- EI24
- EIF2B2
- EIF4G2
- EMCN
- ERCC1
- ERG
- FAM107A
- FAM124B
- FBL
- FDPS
- FEZ2
- FLT1
- FLT4
- FOXC2
- FXR1
- G6PC3
- GDF3
- GIMAP4
- GIMAP6
- GIT1
- GJA4
- GNB1
- GOT2
- GPR4
- HSP90B1
- HSPA4
- HTR1B
- HTR2B
- HYAL2
- IGF2BP3
- IPO7
- ITGB1BP1
- KANK3
- KDR
- KIF20A
- KLHL9
- KRT19
- LRRC59
- LYL1
- LYPLA1
- LYVE1
- MAPK12
- METTL3
- MMRN1
- MMRN2
- MNAT1
- MRPL17
- MTCH1
- MTG1
- MTMR2
- MYCT1
- MYL12B
- MYL6
- N4BP3
- NCBP2
- NEDD8
- NETO2
- NNAT
- NOTCH4
- NOVA2
- NPLOC4
- PCDH12
- PCGF3
- PDE3A
- PDIA6
- PIK3C2A
- PITRM1
- PLS3
- PLVAP
- PNP
- PPM1F
- PPP2R2A
- PRKD2
- PRPF19
- PSMB7
- PSMC5
- PSMD1
- PSMD10
- PSMD2
- PTTG1IP
- PTTG2
- PWP1
- RALA
- RANGAP1
- RASIP1
- RCN2
- RELA
- RHOC
- ROBO4
- RPS14
- S100A6
- SAE1
- SCARF1
- SELE
- SEMA6B
- SEMA6C
- SH3GL1
- SLC16A1
- SNTB2
- SOX18
- SPATS2
- SPTBN5
- SSBP1
- STAB1
- STK25
- STRAP
- TACSTD2
- TAOK2
- TARBP2
- TEK
- TIE1
- TIMM17A
- TJP1
- TMED9
- TMEM184B
- TMEM39B
- TNFSF18
- TNPO1
- TPD52L2
- TTLL5
- TUSC2
- TUT1
- TXNDC9
- VWF
- WDR4
- YKT6
- More...
Gene association
Number of significant genes with P-value ≤ 10-6 for each cohorts are summarized in bar plots. The scatter plot highlights significant associations diven by protein rather than mRNA abundance.
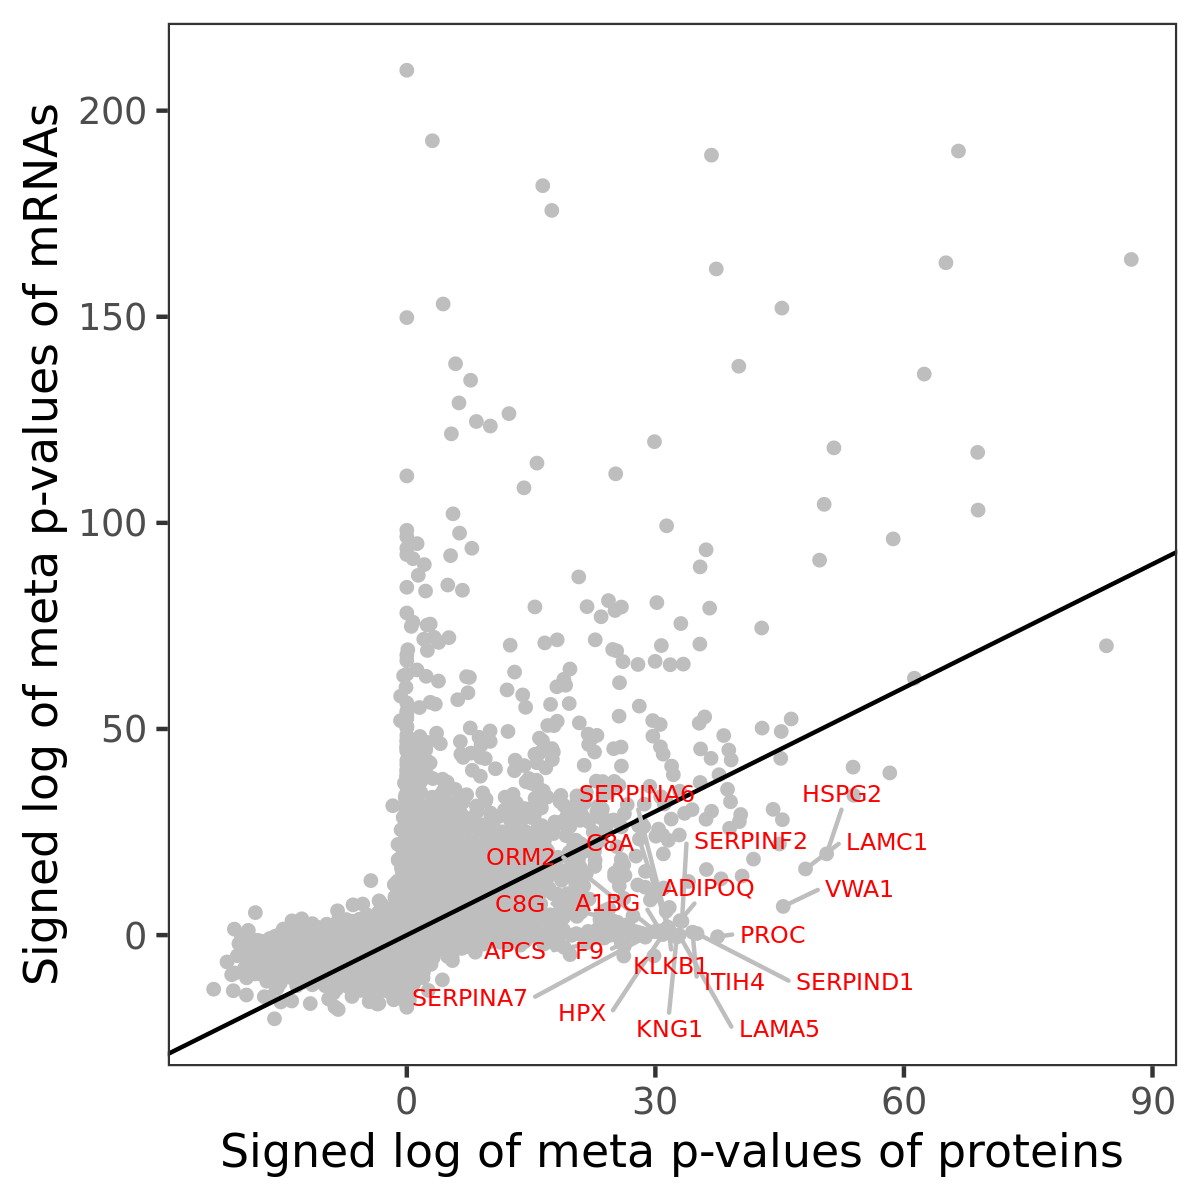
Association of protein abundance of genes
| Signed p-values | |||||||||||
|---|---|---|---|---|---|---|---|---|---|---|---|
| Gene | Meta P | BRCA | CCRCC | COAD | GBM | HNSCC | LSCC | LUAD | OV | PDAC | UCEC |
Gene set enrichment analysis
Submit genes and the common logarithm of the p-values of their association with xcell: Endothelial cell to WebGestalt.
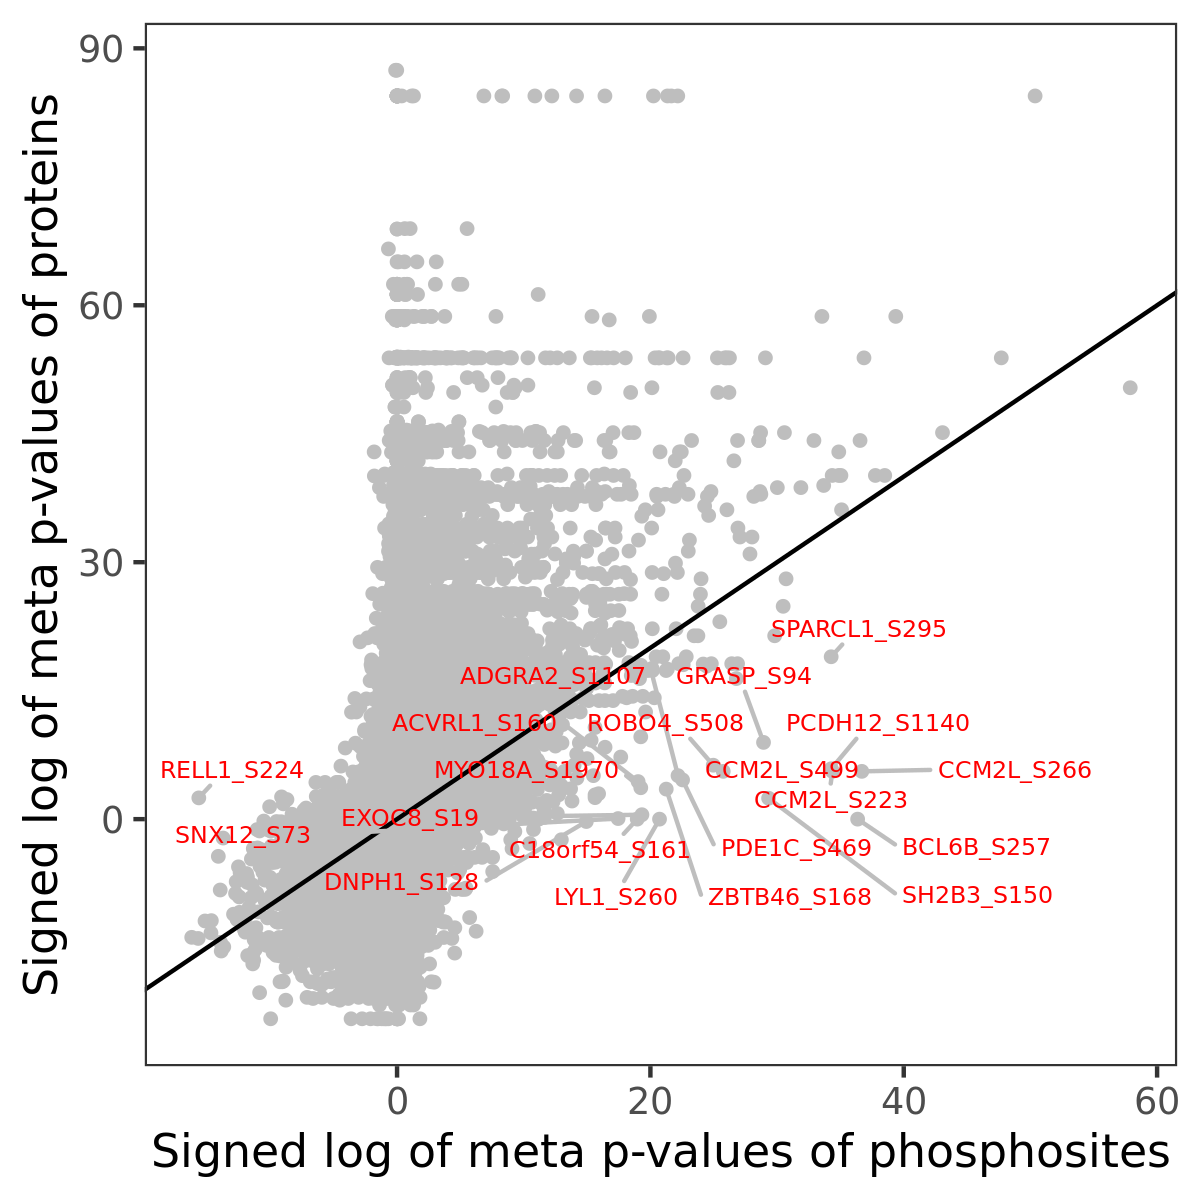
Phosphosite association
Number of significant genes with P-value ≤ 10-6 for each cohorts are summarized in the bar plot. The scatter plot highlights significant associations diven by phosphorylation rather than protein abundance.
| Signed p-values | |||||||||||||
|---|---|---|---|---|---|---|---|---|---|---|---|---|---|
| Gene | Protein | Site | Meta P | BRCA | CCRCC | COAD | GBM | HNSCC | LSCC | LUAD | OV | PDAC | UCEC |
Gene set enrichment analysis
Submit phosphorylation sites and the common logarithm of the p-values of their association with xcell: Endothelial cell to WebGestalt.