Basic information
- Phenotype
- xcell: Myeloid dendritic cell
- Description
- Enrichment score inferring the proportion of myeloid dendritic cells in the tumor derived from RNA data using the xCell tool.
- Source
- https://genomebiology.biomedcentral.com/articles/10.1186/s13059-017-1349-1
- Method
- The R package immunedeconv (V2.0.4) (PMID: 31510660) was used to perform immune cell deconvolution using RNA expression data (TPM).
- Genes
-
- ALCAM
- ALDH1A2
- ALOX15
- ALOX15B
- ARL8B
- BCL2L11
- BCL2L13
- C1QA
- C1QB
- CAMK1G
- CCDC81
- CCL13
- CCL17
- CCL18
- CCL19
- CCL22
- CCL23
- CCL24
- CCL8
- CCR7
- CD1A
- CD1B
- CD1C
- CD1E
- CD209
- CD80
- CD86
- CD9
- CEP350
- CLEC10A
- CUL1
- DNASE1L3
- DPYS
- ETV3
- F13A1
- FBXL4
- FCER2
- FGL2
- FPR3
- GRIN1
- GRSF1
- GUCA1A
- GUCA1A_ENSG00000048545
- HCRTR2
- HK3
- HLA-DQA1
- HPS5
- HS3ST2
- IL12B
- IL21R
- IRF4
- KCNC3
- KCNK13
- KCNN1
- MAP3K13
- MAP3K6
- MCF2
- MPHOSPH6
- MS4A4A
- MS4A6A
- NAGPA
- NECAP2
- NFKB1
- NXPH3
- PLD2
- PRRG2
- PTGES2
- PTGIR
- RAB8A
- RNF2
- RRP1B
- SAMSN1
- SIGLEC1
- SLAMF1
- SLAMF8
- SLC30A4
- SLCO5A1
- SNX11
- SPINT2
- STAB1
- SUZ12
- TACSTD2
- TBC1D13
- TDRD7
- TFEC
- TMEM131
- TMSB10
- TNFRSF4
- TRAF1
- TREM2
- TXN
- UBE2Z
- VAV2
- More...
Gene association
Number of significant genes with P-value ≤ 10-6 for each cohorts are summarized in bar plots. The scatter plot highlights significant associations diven by protein rather than mRNA abundance.
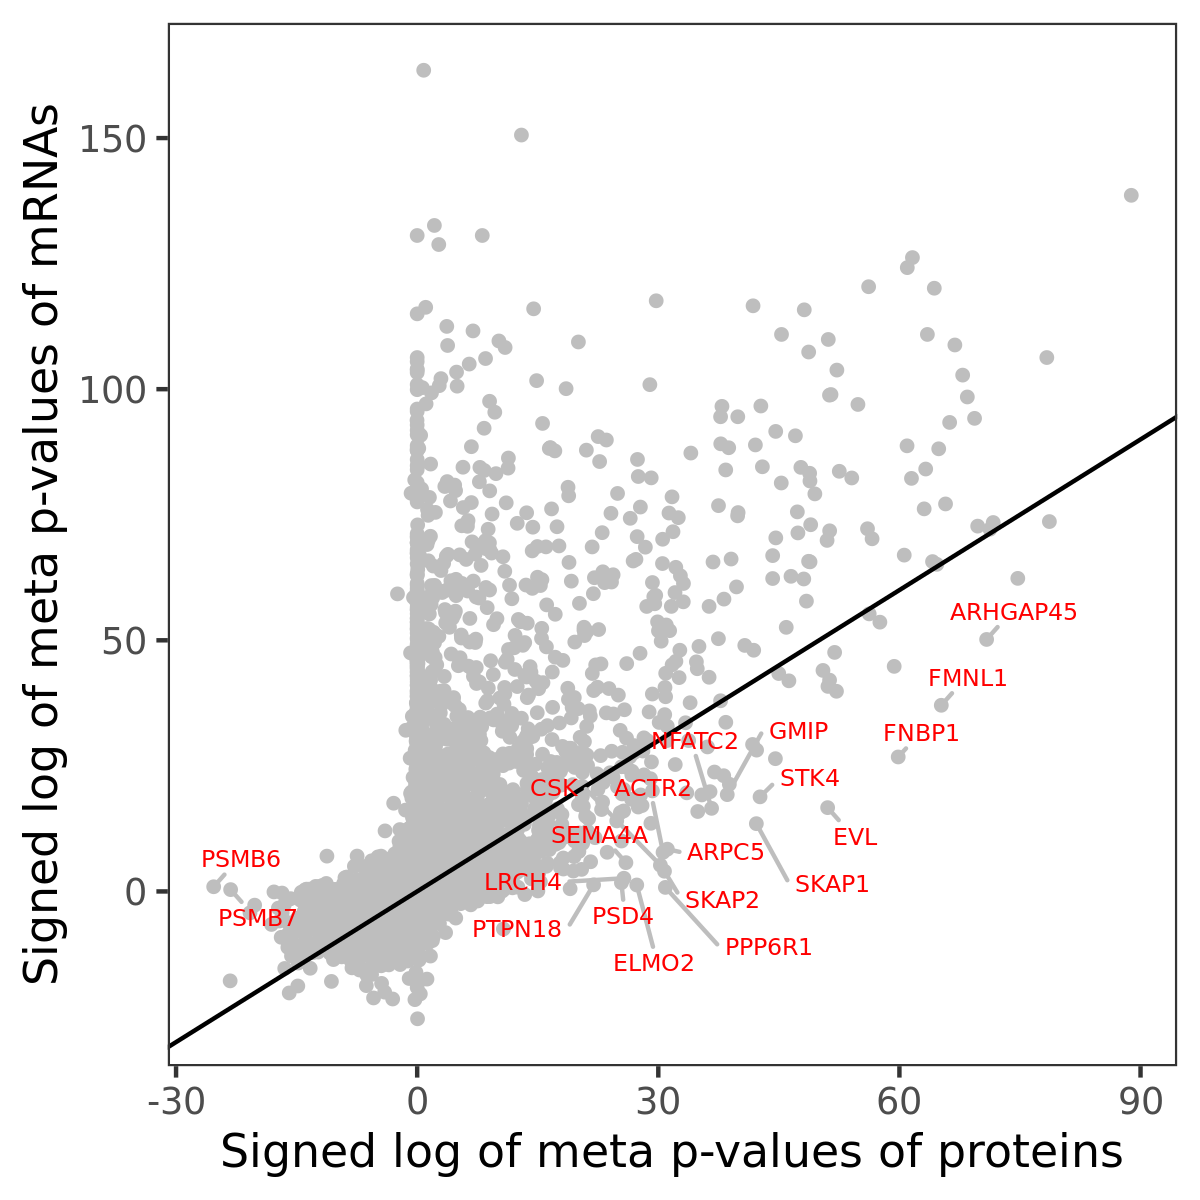
Association of protein abundance of genes
| Signed p-values | |||||||||||
|---|---|---|---|---|---|---|---|---|---|---|---|
| Gene | Meta P | BRCA | CCRCC | COAD | GBM | HNSCC | LSCC | LUAD | OV | PDAC | UCEC |
Gene set enrichment analysis
Submit genes and the common logarithm of the p-values of their association with xcell: Myeloid dendritic cell to WebGestalt.
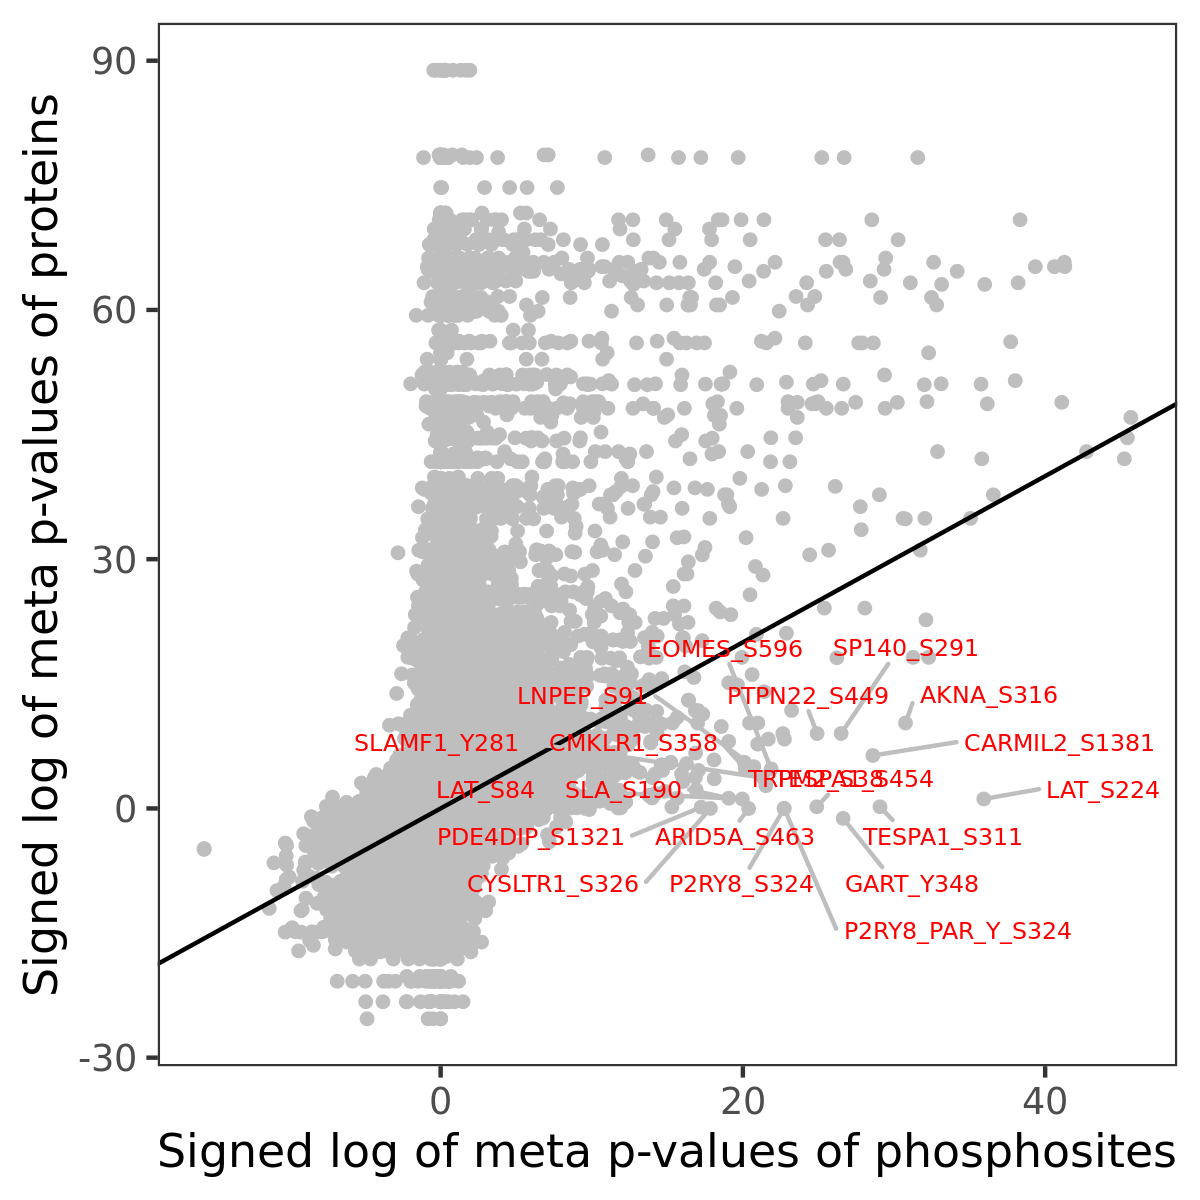
Phosphosite association
Number of significant genes with P-value ≤ 10-6 for each cohorts are summarized in the bar plot. The scatter plot highlights significant associations diven by phosphorylation rather than protein abundance.
| Signed p-values | |||||||||||||
|---|---|---|---|---|---|---|---|---|---|---|---|---|---|
| Gene | Protein | Site | Meta P | BRCA | CCRCC | COAD | GBM | HNSCC | LSCC | LUAD | OV | PDAC | UCEC |
Gene set enrichment analysis
Submit phosphorylation sites and the common logarithm of the p-values of their association with xcell: Myeloid dendritic cell to WebGestalt.