Basic information
- Phenotype
- xcell: Myeloid dendritic cell activated
- Description
- Enrichment score inferring the proportion of activated myeloid dendritic cells in the tumor derived from RNA data using the xCell tool.
- Source
- https://genomebiology.biomedcentral.com/articles/10.1186/s13059-017-1349-1
- Method
- The R package immunedeconv (V2.0.4) (PMID: 31510660) was used to perform immune cell deconvolution using RNA expression data (TPM).
- Genes
-
- ABI1
- ABTB2
- ACHE
- ACOT9
- ADPGK
- ADPRH
- ALDH1A2
- ALOX15B
- ANKFY1
- ANXA5
- ARF3
- ARFRP1
- ARHGEF11
- ARL8B
- ARPC4
- ATP1B3
- AZIN1
- BCKDK
- BCL2L11
- BCL2L13
- BLVRA
- C1QA
- C1QB
- C3AR1
- C5orf15
- CAMK1G
- CASP5
- CCL1
- CCL13
- CCL17
- CCL18
- CCL19
- CCL22
- CCL23
- CCL24
- CCL4
- CCL7
- CCL8
- CCR5
- CD209
- CD300C
- CD80
- CD86
- CHFR
- CHMP5
- CLIP1
- CMKLR1
- CUL1
- CXCL13
- CXCL9
- CYTH4
- DENND1A
- DNAJA1
- DNPEP
- DOT1L
- DYNLT1
- EIF5
- ELL
- ENO1
- ETV3
- EXOC5
- FBXL4
- FCER1G
- FCER2
- FPR3
- GMFB
- GNG5
- GPN2
- GPR107
- GPR132
- GRB2
- H6PD
- HAMP
- HCK
- HLA-DQA1
- HPS5
- HRH2
- HS3ST3B1
- IL10
- IL10RA
- IL12B
- IL19
- IL2RA
- IL3RA
- IL3RA_PAR_Y
- IL9
- IMPDH1
- IRF4
- KCNK13
- KCNMB1
- KDM6B
- LAIR1
- LILRA5
- LILRB1
- LILRB2
- LILRB5
- MAGT1
- MAP2K1
- MAP3K13
- MED25
- MFN1
- MGRN1
- MIIP
- MMP25
- MTF1
- MTHFD2
- N4BP1
- NECAP2
- NETO2
- NEU3
- NFE2L2
- NFKB1
- NFKBIB
- NRAS
- NSUN3
- NUP62
- OGFR
- OPA3
- OSM
- P2RX7
- PAK2
- PGK1
- PITPNA
- PTGIR
- RAB21
- RAB35
- RAB5A
- RAB8A
- RAMP3
- RAPGEF1
- RELA
- RHOG
- RIN2
- RPGRIP1
- RRP1
- S100A10
- SCARF1
- SCYL2
- SEC24A
- SIGLEC1
- SIGLEC7
- SIGLEC9
- SLAMF1
- SLC1A2
- SLC25A28
- SLC6A12
- SLCO5A1
- SNX11
- SOCS3
- SPAG9
- SRC
- STAT2
- TAX1BP1
- TBC1D13
- TBC1D22B
- TCF21
- TDRD7
- TFEC
- TMCC2
- TMEM41B
- TMSB10
- TMX1
- TNFRSF4
- TNIP2
- TOR1B
- TPI1
- TRAF1
- TREX1
- TRIP4
- TRPC4AP
- TXN
- UBE2Z
- VRK2
- WTAP
- XIAP
- XPNPEP1
- ZBTB17
- ZNF654
- More...
Gene association
Number of significant genes with P-value ≤ 10-6 for each cohorts are summarized in bar plots. The scatter plot highlights significant associations diven by protein rather than mRNA abundance.
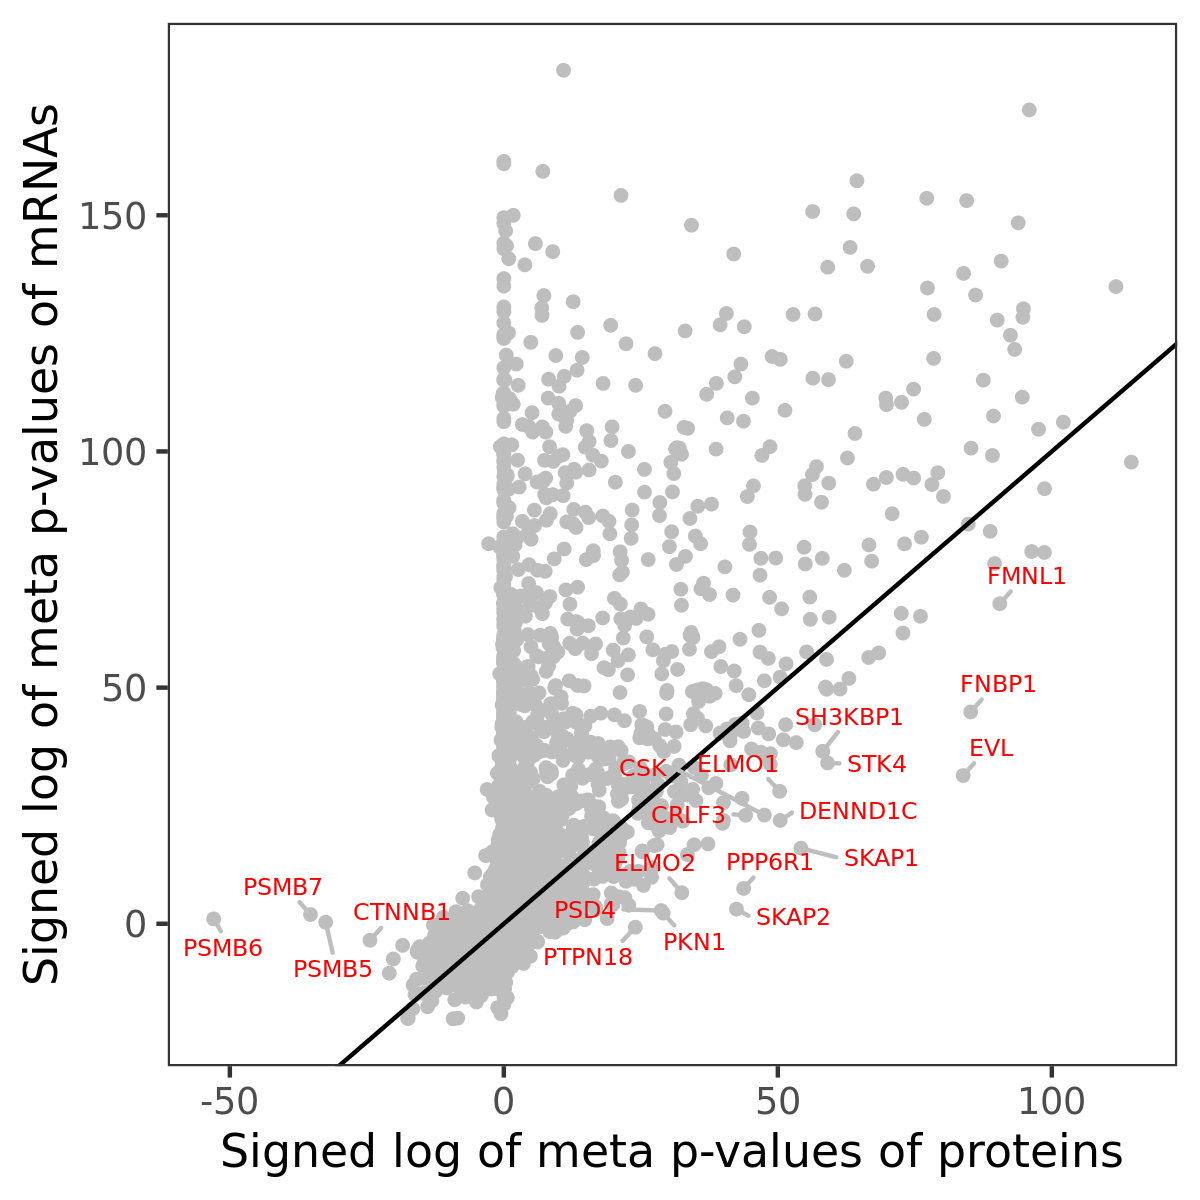
Association of protein abundance of genes
| Signed p-values | |||||||||||
|---|---|---|---|---|---|---|---|---|---|---|---|
| Gene | Meta P | BRCA | CCRCC | COAD | GBM | HNSCC | LSCC | LUAD | OV | PDAC | UCEC |
Gene set enrichment analysis
Submit genes and the common logarithm of the p-values of their association with xcell: Myeloid dendritic cell activated to WebGestalt.
Phosphosite association
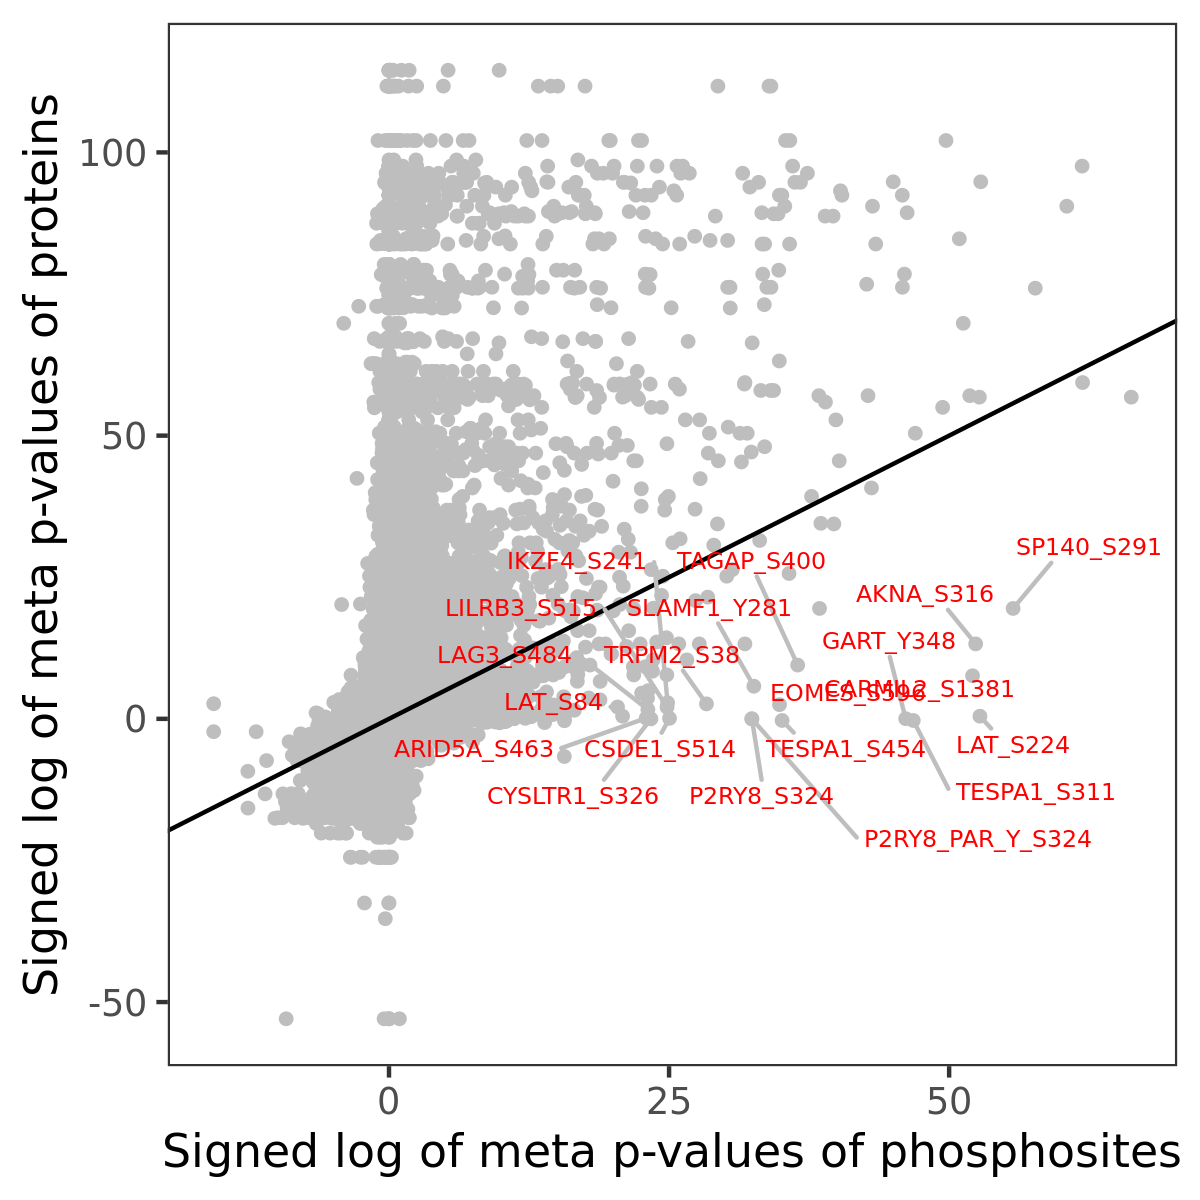
Number of significant genes with P-value ≤ 10-6 for each cohorts are summarized in the bar plot. The scatter plot highlights significant associations diven by phosphorylation rather than protein abundance.
| Signed p-values | |||||||||||||
|---|---|---|---|---|---|---|---|---|---|---|---|---|---|
| Gene | Protein | Site | Meta P | BRCA | CCRCC | COAD | GBM | HNSCC | LSCC | LUAD | OV | PDAC | UCEC |
Gene set enrichment analysis
Submit phosphorylation sites and the common logarithm of the p-values of their association with xcell: Myeloid dendritic cell activated to WebGestalt.