Basic information
- Phenotype
- HALLMARK_CHOLESTEROL_HOMEOSTASIS
- Description
- Enrichment score representing cholesterol homeostasis. The score was calculated using ssGSEA on the RNA data (Z-score transformed coding genes with expression in at least 50% of the samples in a cohort).
- Source
- http://www.gsea-msigdb.org/gsea/msigdb/cards/HALLMARK_CHOLESTEROL_HOMEOSTASIS.html
- Method
- Single sample gene set enrichment analysis (ssGSEA) was performed for each cancer type using gene-wise Z-scores of the RNA expression data (RSEM) for the MSigDB Hallmark gene sets v7.0 (PMID: 26771021) via the ssGSEA2.0 R package (PMID: 30563849). RNA data were filtered to coding genes with < 50% 0 expression. (Parameters: sample.norm.type="rank", weight=0.75, statistic="area.under.RES", nperm=1000, min.overlap=10). Pathway activity scores are normalized enrichment scores from ssGSEA.
- Genes
-
- ACAT2
- ACSS2
- ACTG1
- ADH4
- ALCAM
- ALDOC
- ANTXR2
- ANXA13
- ANXA5
- ATF3
- ATF5
- ATXN2
- AVPR1A
- CBS
- CD9
- CHKA
- CLU
- CPEB2
- CTNNB1
- CXCL16
- CYP51A1
- DHCR7
- EBP
- ECH1
- ERRFI1
- ETHE1
- FABP5
- FADS2
- FASN
- FBXO6
- FDFT1
- FDPS
- GLDC
- GNAI1
- GPX8
- GSTM2
- GUSB
- HMGCR
- HMGCS1
- HSD17B7
- IDI1
- JAG1
- LDLR
- LGALS3
- LGMN
- LPL
- LSS
- MAL2
- MVD
- MVK
- NFIL3
- NIBAN1
- NSDHL
- PCYT2
- PDK3
- PLAUR
- PLSCR1
- PMVK
- PNRC1
- PPARG
- S100A11
- SC5D
- SCD
- SEMA3B
- SQLE
- SREBF2
- STARD4
- STX5
- TM7SF2
- TMEM97
- TNFRSF12A
- TP53INP1
- TRIB3
- More...
Gene association
Number of significant genes with P-value ≤ 10-6 for each cohorts are summarized in bar plots. The scatter plot highlights significant associations diven by protein rather than mRNA abundance.
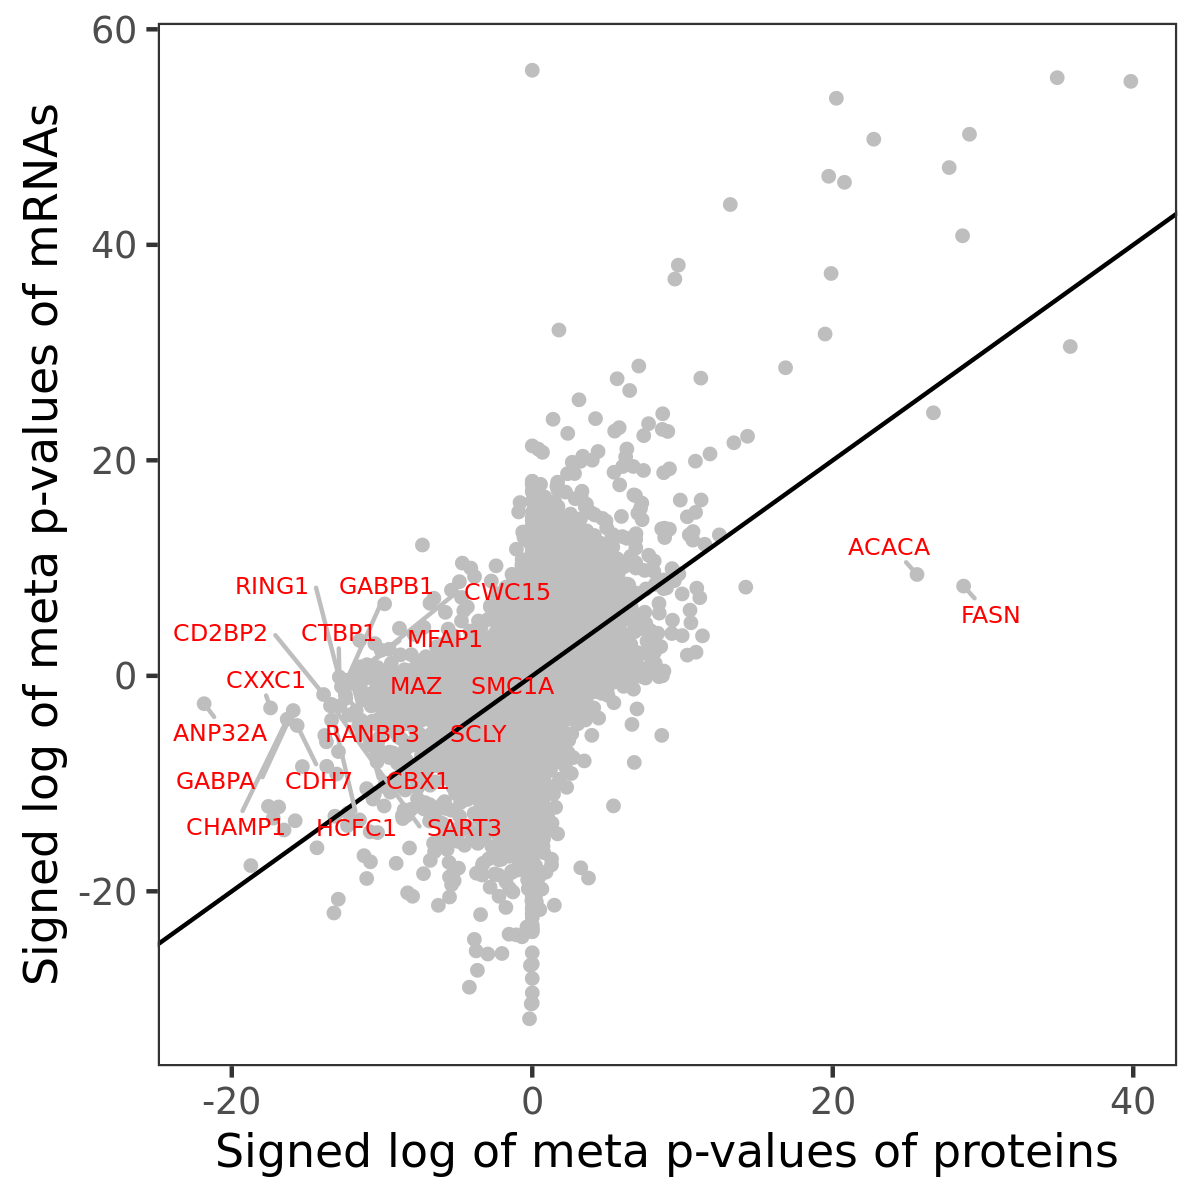
Association of protein abundance of genes
Signed p-values | ||||||||||||
|---|---|---|---|---|---|---|---|---|---|---|---|---|
Gene | Meta P | BRCA | CCRCC | COAD | GBM | HNSCC | LSCC | LUAD | OV | PDAC | UCEC | |
| No matching records found | ||||||||||||
Gene set enrichment analysis
Submit genes and the common logarithm of the p-values of their association with HALLMARK_CHOLESTEROL_HOMEOSTASIS to WebGestalt.
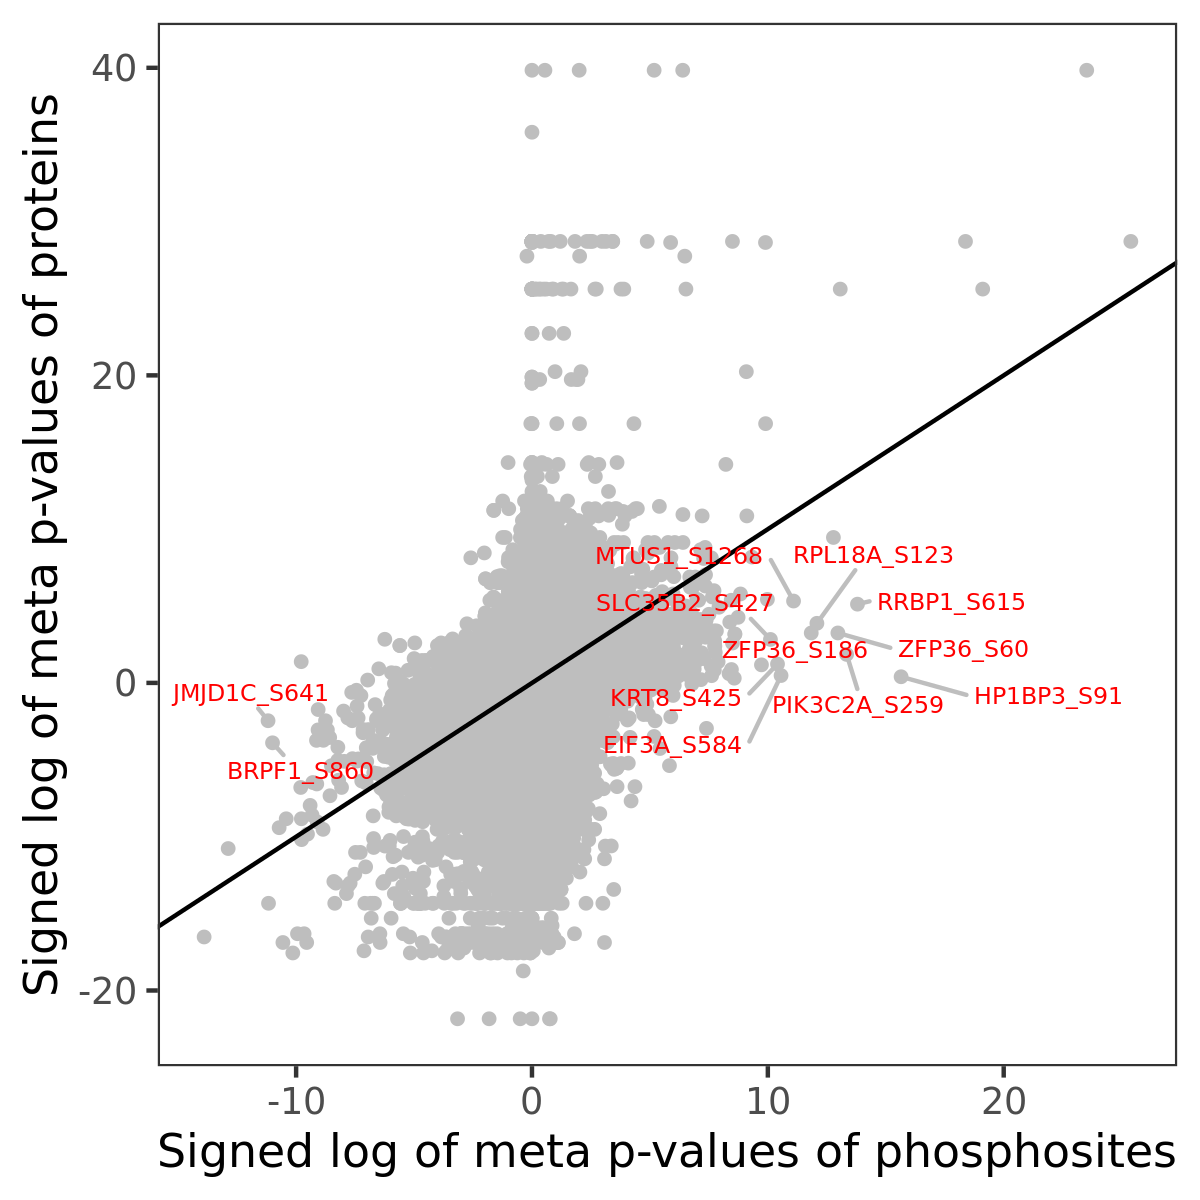
Phosphosite association
Number of significant genes with P-value ≤ 10-6 for each cohorts are summarized in the bar plot. The scatter plot highlights significant associations diven by phosphorylation rather than protein abundance.
Signed p-values | |||||||||||||
|---|---|---|---|---|---|---|---|---|---|---|---|---|---|
Gene | Protein | Site | Meta P | BRCA | CCRCC | COAD | GBM | HNSCC | LSCC | LUAD | OV | PDAC | UCEC |
| No matching records found | |||||||||||||
Gene set enrichment analysis
Submit phosphorylation sites and the common logarithm of the p-values of their association with HALLMARK_CHOLESTEROL_HOMEOSTASIS to WebGestalt.