Basic information
- Phenotype
- HALLMARK_KRAS_SIGNALING_UP
- Description
- Enrichment score representing genes increased by KRAS activation. The score was calculated using ssGSEA on the RNA data (Z-score transformed coding genes with expression in at least 50% of the samples in a cohort).
- Source
- http://www.gsea-msigdb.org/gsea/msigdb/cards/HALLMARK_KRAS_SIGNALING_UP.html
- Method
- Single sample gene set enrichment analysis (ssGSEA) was performed for each cancer type using gene-wise Z-scores of the RNA expression data (RSEM) for the MSigDB Hallmark gene sets v7.0 (PMID: 26771021) via the ssGSEA2.0 R package (PMID: 30563849). RNA data were filtered to coding genes with < 50% 0 expression. (Parameters: sample.norm.type="rank", weight=0.75, statistic="area.under.RES", nperm=1000, min.overlap=10). Pathway activity scores are normalized enrichment scores from ssGSEA.
- Genes
-
- ACE
- ADAM17
- ADAM8
- ADAMDEC1
- ADGRA2
- ADGRL4
- AKAP12
- AKT2
- ALDH1A2
- ALDH1A3
- AMMECR1
- ANGPTL4
- ANKH
- ANO1
- ANXA10
- APOD
- ARG1
- ATG10
- AVL9
- BIRC3
- BMP2
- BPGM
- BTBD3
- BTC
- C3AR1
- CA2
- CAB39L
- CBL
- CBR4
- CBX8
- CCL20
- CCND2
- CCSER2
- CD37
- CDADC1
- CFB
- CFH
- CFHR2
- CIDEA
- CLEC4A
- CMKLR1
- CPE
- CROT
- CSF2
- CSF2RA_PAR_Y
- CTSS
- CXCL10
- CXCR4
- DCBLD2
- DNMBP
- DOCK2
- DUSP6
- EMP1
- ENG
- EPB41L3
- EPHB2
- EREG
- ERO1A
- ETS1
- ETV1
- ETV4
- ETV5
- EVI5
- F13A1
- F2RL1
- FBXO4
- FCER1G
- FGF9
- FLT4
- FUCA1
- G0S2
- GABRA3
- GADD45G
- GALNT3
- GFPT2
- GLRX
- GNG11
- GPNMB
- GPRC5B
- GUCY1A1
- GYPC
- H2BC3
- HBEGF
- HDAC9
- HKDC1
- HOXD11
- HSD11B1
- ID2
- IGF2
- IGFBP3
- IKZF1
- IL10RA
- IL1B
- IL1RL2
- IL2RG
- IL33
- IL7R
- INHBA
- IRF8
- ITGA2
- ITGB2
- ITGBL1
- JUP
- KCNN4
- KIF5C
- KLF4
- LAPTM5
- LAT2
- LCP1
- LIF
- LY96
- MAFB
- MALL
- MAP3K1
- MAP4K1
- MAP7
- MMD
- MMP10
- MMP11
- MMP9
- MPZL2
- MTMR10
- MYCN
- NAP1L2
- NGF
- NIN
- NR0B2
- NR1H4
- NRP1
- PCP4
- PCSK1N
- PDCD1LG2
- PECAM1
- PEG3
- PIGR
- PLAT
- PLAU
- PLAUR
- PLEK2
- PLVAP
- PPBP
- PPP1R15A
- PRDM1
- PRELID3B
- PRKG2
- PRRX1
- PSMB8
- PTBP2
- PTCD2
- PTGS2
- PTPRR
- RABGAP1L
- RBM4
- RBP4
- RELN
- RETN
- RGS16
- SATB1
- SCG3
- SCG5
- SCN1B
- SDCCAG8
- SEMA3B
- SERPINA3
- SLPI
- SNAP25
- SNAP91
- SOX9
- SPARCL1
- SPON1
- SPP1
- SPRY2
- ST6GAL1
- STRN
- TFPI
- TLR8
- TMEM100
- TMEM158
- TMEM176A
- TMEM176B
- TNFAIP3
- TNFRSF1B
- TNNT2
- TOR1AIP2
- TPH1
- TRAF1
- TRIB1
- TRIB2
- TSPAN1
- TSPAN13
- TSPAN7
- USH1C
- USP12
- VWA5A
- WDR33
- WNT7A
- YRDC
- ZNF277
- ZNF639
- More...
Gene association
Number of significant genes with P-value ≤ 10-6 for each cohorts are summarized in bar plots. The scatter plot highlights significant associations diven by protein rather than mRNA abundance.
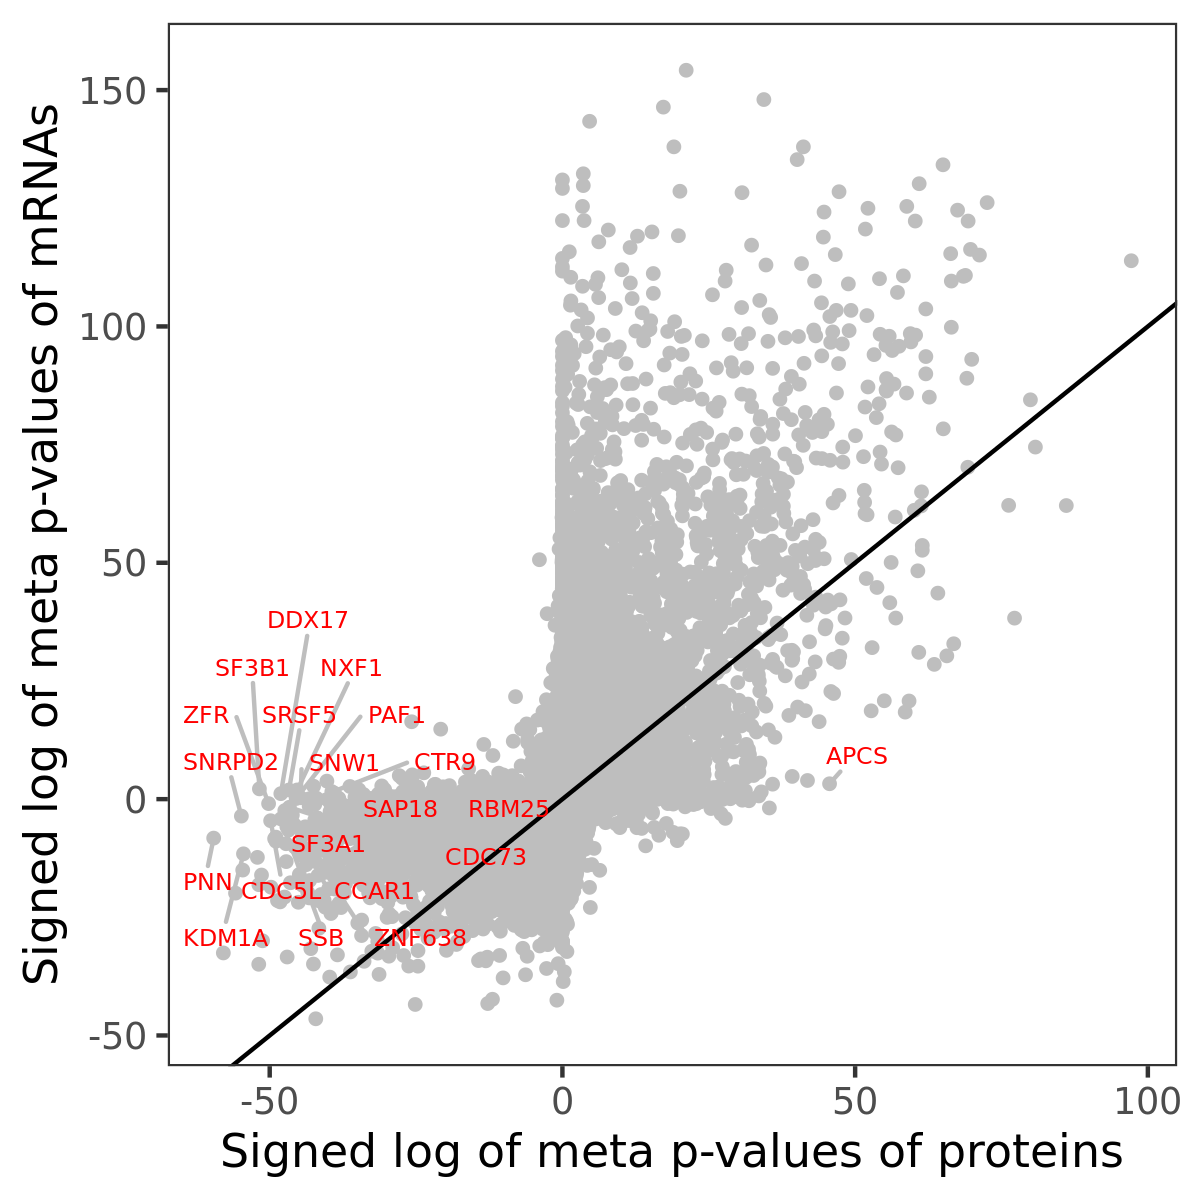
Association of protein abundance of genes
Signed p-values | ||||||||||||
|---|---|---|---|---|---|---|---|---|---|---|---|---|
Gene | Meta P | BRCA | CCRCC | COAD | GBM | HNSCC | LSCC | LUAD | OV | PDAC | UCEC | |
| No matching records found | ||||||||||||
Gene set enrichment analysis
Submit genes and the common logarithm of the p-values of their association with HALLMARK_KRAS_SIGNALING_UP to WebGestalt.
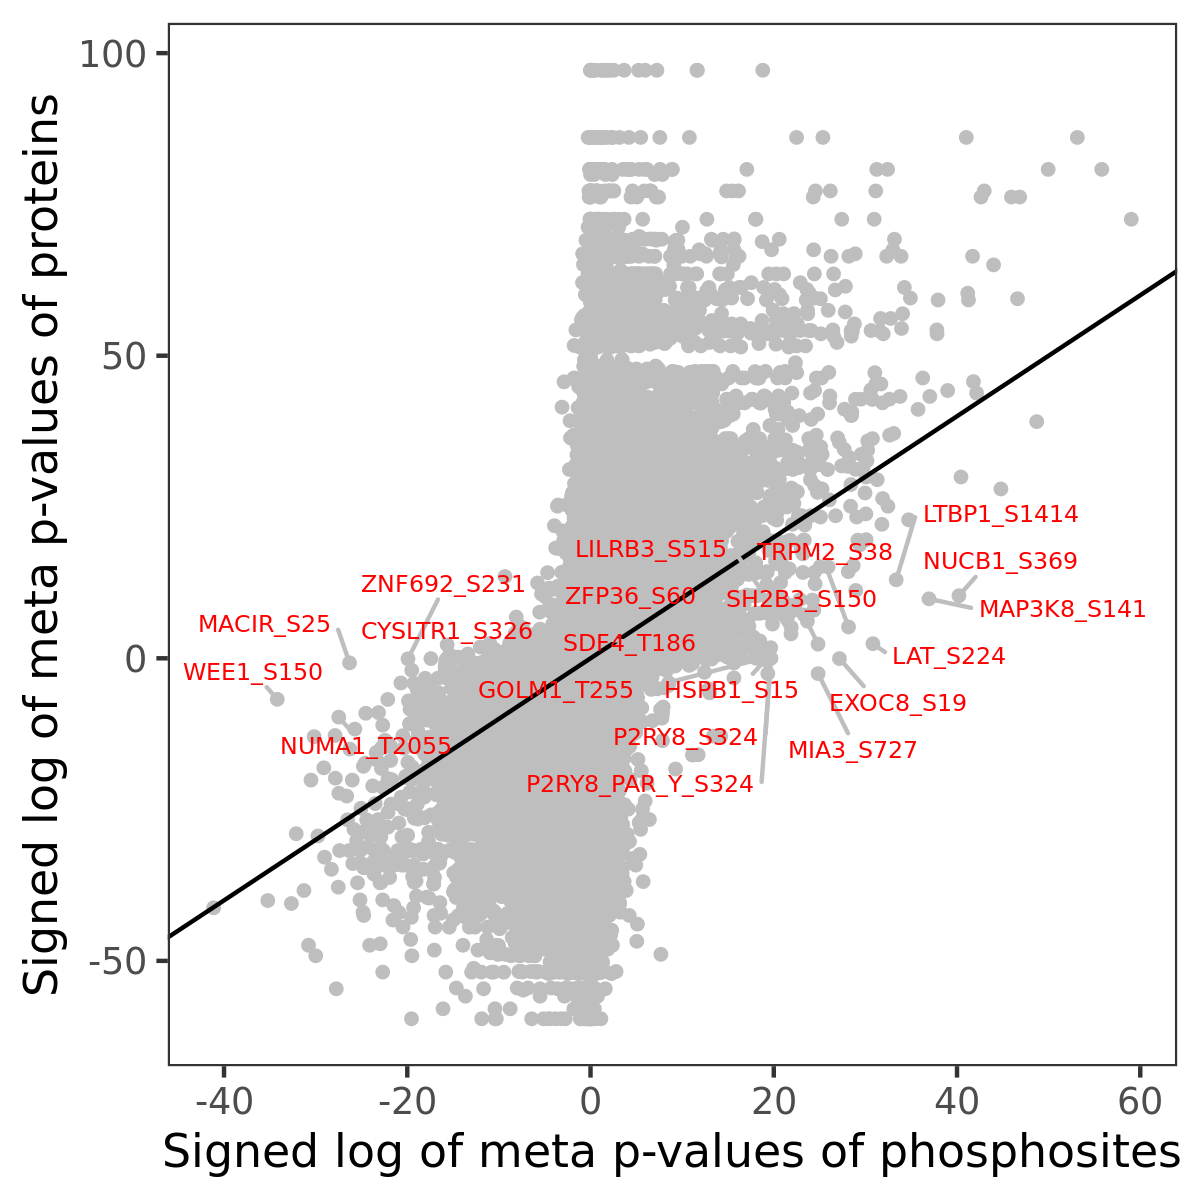
Phosphosite association
Number of significant genes with P-value ≤ 10-6 for each cohorts are summarized in the bar plot. The scatter plot highlights significant associations diven by phosphorylation rather than protein abundance.
Signed p-values | |||||||||||||
|---|---|---|---|---|---|---|---|---|---|---|---|---|---|
Gene | Protein | Site | Meta P | BRCA | CCRCC | COAD | GBM | HNSCC | LSCC | LUAD | OV | PDAC | UCEC |
| No matching records found | |||||||||||||
Gene set enrichment analysis
Submit phosphorylation sites and the common logarithm of the p-values of their association with HALLMARK_KRAS_SIGNALING_UP to WebGestalt.