Basic information
- Phenotype
- HALLMARK_OXIDATIVE_PHOSPHORYLATION
- Description
- Enrichment score representing genes involved in oxidative phosphorylation. The score was calculated using ssGSEA on the RNA data (Z-score transformed coding genes with expression in at least 50% of the samples in a cohort).
- Source
- http://www.gsea-msigdb.org/gsea/msigdb/cards/HALLMARK_OXIDATIVE_PHOSPHORYLATION.html
- Method
- Single sample gene set enrichment analysis (ssGSEA) was performed for each cancer type using gene-wise Z-scores of the RNA expression data (RSEM) for the MSigDB Hallmark gene sets v7.0 (PMID: 26771021) via the ssGSEA2.0 R package (PMID: 30563849). RNA data were filtered to coding genes with < 50% 0 expression. (Parameters: sample.norm.type="rank", weight=0.75, statistic="area.under.RES", nperm=1000, min.overlap=10). Pathway activity scores are normalized enrichment scores from ssGSEA.
- Genes
-
- ACAA1
- ACAA2
- ACADM
- ACADSB
- ACADVL
- ACAT1
- ACO2
- AFG3L2
- AIFM1
- ALAS1
- ALDH6A1
- ATP1B1
- ATP5F1A
- ATP5F1B
- ATP5F1C
- ATP5F1D
- ATP5F1E
- ATP5MC1
- ATP5MC2
- ATP5MC3
- ATP5ME
- ATP5MF
- ATP5MG
- ATP5PB
- ATP5PD
- ATP5PF
- ATP5PO
- ATP6AP1
- ATP6V0B
- ATP6V0C
- ATP6V0E1
- ATP6V1C1
- ATP6V1D
- ATP6V1E1
- ATP6V1F
- ATP6V1G1
- ATP6V1H
- BAX
- BCKDHA
- BDH2
- CASP7
- COX10
- COX11
- COX15
- COX17
- COX4I1
- COX5A
- COX5B
- COX6A1
- COX6B1
- COX6C
- COX7A2
- COX7A2L
- COX7B
- COX7C
- COX8A
- CPT1A
- CS
- CYB5A
- CYB5R3
- CYC1
- CYCS
- DECR1
- DLAT
- DLD
- DLST
- ECH1
- ECHS1
- ECI1
- ETFA
- ETFB
- ETFDH
- FDX1
- FH
- FXN
- GLUD1
- GOT2
- GPI
- GPX4
- GRPEL1
- HADHA
- HADHB
- HCCS
- HSD17B10
- HSPA9
- HTRA2
- IDH1
- IDH2
- IDH3A
- IDH3B
- IDH3G
- IMMT
- ISCA1
- ISCU
- LDHA
- LDHB
- LRPPRC
- MAOB
- MDH1
- MDH2
- MFN2
- MGST3
- MPC1
- MRPL11
- MRPL15
- MRPL34
- MRPL35
- MRPS11
- MRPS12
- MRPS15
- MRPS22
- MRPS30
- MTRF1
- MTRR
- MTX2
- NDUFA1
- NDUFA2
- NDUFA3
- NDUFA4
- NDUFA5
- NDUFA6
- NDUFA7
- NDUFA8
- NDUFA9
- NDUFAB1
- NDUFB1
- NDUFB2
- NDUFB3
- NDUFB4
- NDUFB5
- NDUFB6
- NDUFB7
- NDUFB8
- NDUFC1
- NDUFC2
- NDUFS1
- NDUFS2
- NDUFS3
- NDUFS4
- NDUFS6
- NDUFS7
- NDUFS8
- NDUFV1
- NDUFV2
- NNT
- NQO2
- OAT
- OGDH
- OPA1
- OXA1L
- PDHA1
- PDHB
- PDHX
- PDK4
- PDP1
- PHB2
- PHYH
- PMPCA
- POLR2F
- POR
- PRDX3
- RETSAT
- RHOT1
- RHOT2
- SDHA
- SDHB
- SDHC
- SDHD
- SLC25A11
- SLC25A12
- SLC25A20
- SLC25A3
- SLC25A4
- SLC25A5
- SLC25A6_PAR_Y
- SUCLA2
- SUCLG1
- SUPV3L1
- SURF1
- TCIRG1
- TIMM10
- TIMM13
- TIMM17A
- TIMM50
- TIMM8B
- TIMM9
- TOMM22
- TOMM70
- UQCR10
- UQCR11
- UQCRB
- UQCRC1
- UQCRC2
- UQCRFS1
- UQCRH
- UQCRQ
- VDAC1
- VDAC2
- VDAC3
- More...
Gene association
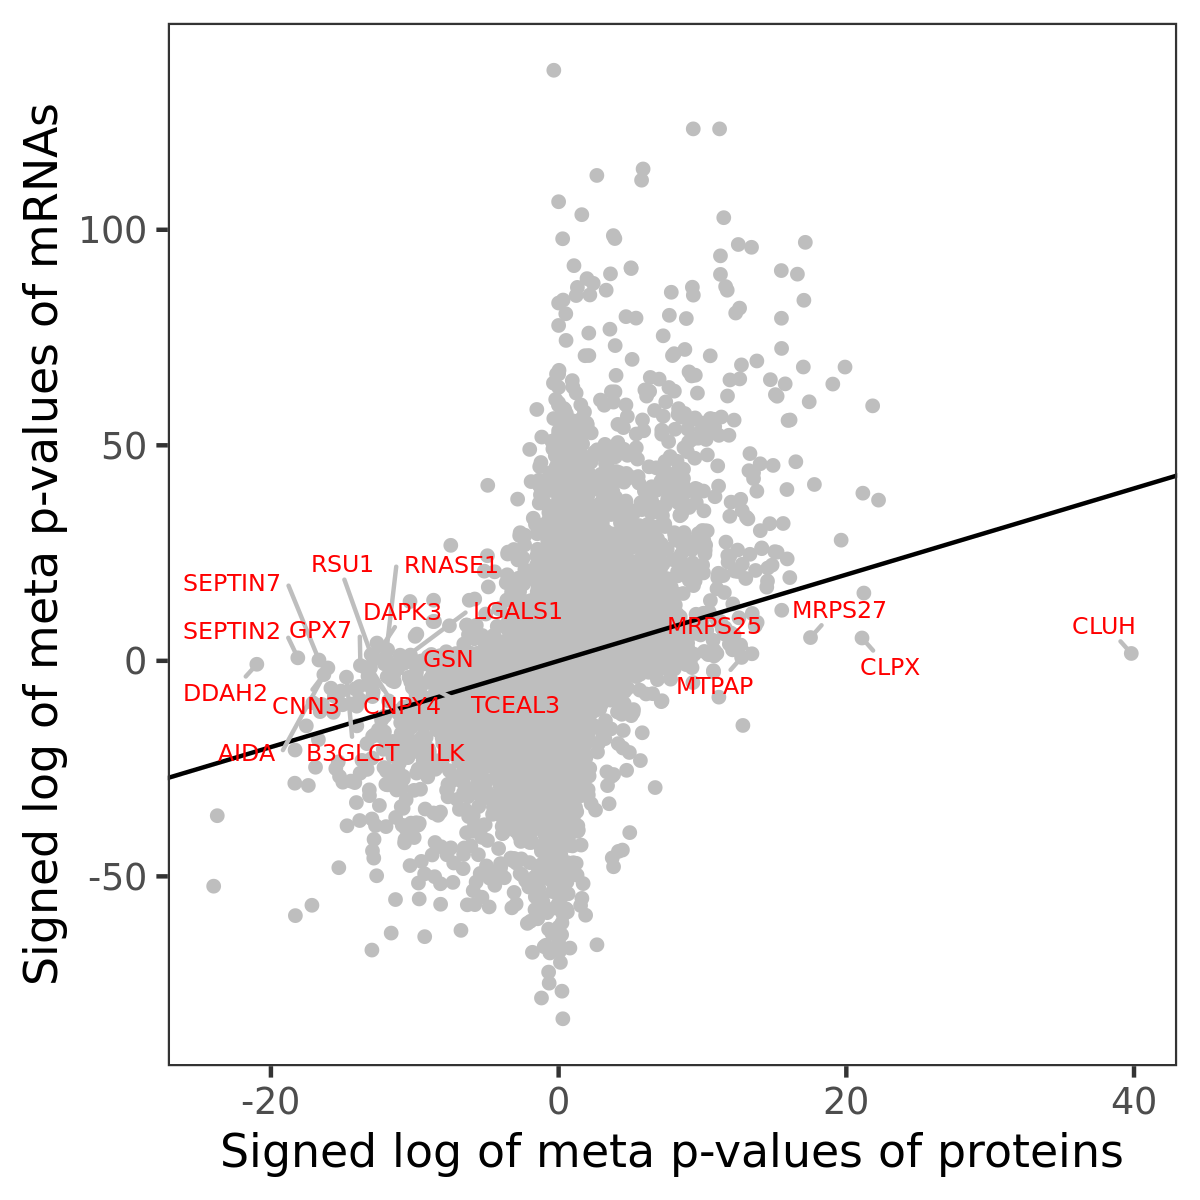
Number of significant genes with P-value ≤ 10-6 for each cohorts are summarized in bar plots. The scatter plot highlights significant associations diven by protein rather than mRNA abundance.

Association of protein abundance of genes
| Signed p-values | |||||||||||
|---|---|---|---|---|---|---|---|---|---|---|---|
| Gene | Meta P | BRCA | CCRCC | COAD | GBM | HNSCC | LSCC | LUAD | OV | PDAC | UCEC |
Gene set enrichment analysis
Submit genes and the common logarithm of the p-values of their association with HALLMARK_OXIDATIVE_PHOSPHORYLATION to WebGestalt.
Phosphosite association
Number of significant genes with P-value ≤ 10-6 for each cohorts are summarized in the bar plot. The scatter plot highlights significant associations diven by phosphorylation rather than protein abundance.

| Signed p-values | |||||||||||||
|---|---|---|---|---|---|---|---|---|---|---|---|---|---|
| Gene | Protein | Site | Meta P | BRCA | CCRCC | COAD | GBM | HNSCC | LSCC | LUAD | OV | PDAC | UCEC |
Gene set enrichment analysis
Submit phosphorylation sites and the common logarithm of the p-values of their association with HALLMARK_OXIDATIVE_PHOSPHORYLATION to WebGestalt.