Basic information
- Phenotype
- HALLMARK_P53_PATHWAY
- Description
- Enrichment score representing the p53 pathway. The score was calculated using ssGSEA on the RNA data (Z-score transformed coding genes with expression in at least 50% of the samples in a cohort).
- Source
- http://www.gsea-msigdb.org/gsea/msigdb/cards/HALLMARK_P53_PATHWAY.html
- Method
- Single sample gene set enrichment analysis (ssGSEA) was performed for each cancer type using gene-wise Z-scores of the RNA expression data (RSEM) for the MSigDB Hallmark gene sets v7.0 (PMID: 26771021) via the ssGSEA2.0 R package (PMID: 30563849). RNA data were filtered to coding genes with < 50% 0 expression. (Parameters: sample.norm.type="rank", weight=0.75, statistic="area.under.RES", nperm=1000, min.overlap=10). Pathway activity scores are normalized enrichment scores from ssGSEA.
- Genes
-
- ABCC5
- ABHD4
- ACVR1B
- ADA
- AEN
- AK1
- ALOX15B
- ANKRA2
- APAF1
- APP
- ATF3
- BAIAP2
- BAK1
- BAX
- BLCAP
- BMP2
- BTG1
- BTG2
- CASP1
- CCND2
- CCND3
- CCNG1
- CCNK
- CCP110
- CD81
- Array
- CD82
- CDH13
- CDK5R1
- CDKN1A
- CDKN2A
- CDKN2AIP
- CDKN2B
- CEBPA
- CGRRF1
- CLCA2
- COQ8A
- CSRNP2
- CTSD
- CTSF
- CYFIP2
- DCXR
- DDB2
- DDIT3
- DDIT4
- DEF6
- DGKA
- DNTTIP2
- DRAM1
- EI24
- ELP1
- EPHA2
- EPHX1
- EPS8L2
- ERCC5
- F2R
- FAM162A
- FAS
- FBXW7
- FDXR
- FGF13
- FOS
- FOXO3
- FUCA1
- GADD45A
- GLS2
- GM2A
- GPX2
- H1-2
- H2AJ
- H2AW
- HBEGF
- HDAC3
- HEXIM1
- HINT1
- HMOX1
- HRAS
- HSPA4L
- IER3
- IER5
- IFI30
- IL1A
- INHBB
- IP6K2
- IRAK1
- ISCU
- ITGB4
- JAG2
- JUN
- KIF13B
- KLF4
- KLK8
- KRT17
- LDHB
- LIF
- LRMP
- MAPKAPK3
- MDM2
- MKNK2
- MXD1
- MXD4
- NDRG1
- NHLH2
- NINJ1
- NOL8
- NOTCH1
- NUDT15
- NUPR1
- OSGIN1
- PCNA
- PDGFA
- PERP
- PHLDA3
- PIDD1
- PITPNC1
- PLK2
- PLK3
- PLXNB2
- PMM1
- POLH
- POM121
- PPM1D
- PPP1R15A
- PRKAB1
- PRMT2
- PROCR
- PTPN14
- PTPRE
- RAB40C
- RACK1
- RAD51C
- RAD9A
- RALGDS
- RAP2B
- RB1
- RCHY1
- RETSAT
- RGS16
- RHBDF2
- RNF19B
- RPL18
- RPL36
- RPS12
- RPS27L
- RRAD
- RRP8
- RXRA
- S100A10
- S100A4
- SAT1
- SDC1
- SEC61A1
- SERPINB5
- SERTAD3
- SESN1
- SFN
- SLC19A2
- SLC35D1
- SLC3A2
- SLC7A11
- SOCS1
- SP1
- SPHK1
- ST14
- STEAP3
- STOM
- TAP1
- TAX1BP3
- TCHH
- TCN2
- TGFA
- TGFB1
- TM4SF1
- TM7SF3
- TNFSF9
- TNNI1
- TOB1
- TP53
- TP63
- TPD52L1
- TPRKB
- TRAF4
- TRAFD1
- TRIAP1
- TRIB3
- TSC22D1
- TSPYL2
- TXNIP
- UPP1
- VAMP8
- VDR
- VWA5A
- WRAP73
- WWP1
- XPC
- ZBTB16
- ZFP36L1
- ZMAT3
- ZNF365
- More...
Gene association
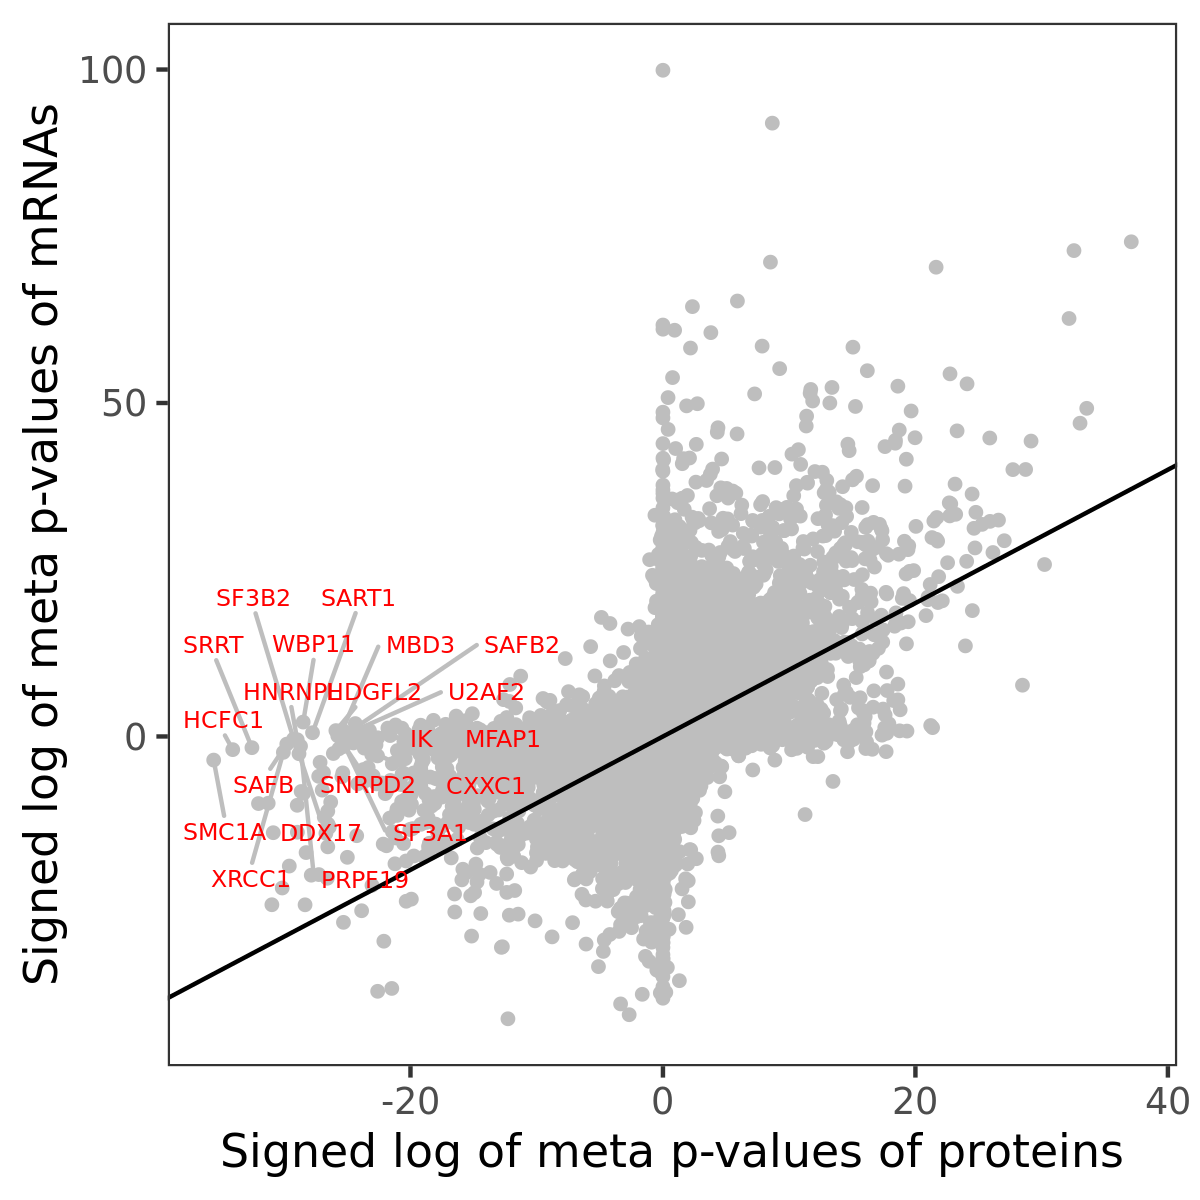
Number of significant genes with P-value ≤ 10-6 for each cohorts are summarized in bar plots. The scatter plot highlights significant associations diven by protein rather than mRNA abundance.

Association of protein abundance of genes
Signed p-values | ||||||||||||
|---|---|---|---|---|---|---|---|---|---|---|---|---|
Gene | Meta P | BRCA | CCRCC | COAD | GBM | HNSCC | LSCC | LUAD | OV | PDAC | UCEC | |
| No matching records found | ||||||||||||
Gene set enrichment analysis
Submit genes and the common logarithm of the p-values of their association with HALLMARK_P53_PATHWAY to WebGestalt.
Phosphosite association
Number of significant genes with P-value ≤ 10-6 for each cohorts are summarized in the bar plot. The scatter plot highlights significant associations diven by phosphorylation rather than protein abundance.

Signed p-values | |||||||||||||
|---|---|---|---|---|---|---|---|---|---|---|---|---|---|
Gene | Protein | Site | Meta P | BRCA | CCRCC | COAD | GBM | HNSCC | LSCC | LUAD | OV | PDAC | UCEC |
| No matching records found | |||||||||||||
Gene set enrichment analysis
Submit phosphorylation sites and the common logarithm of the p-values of their association with HALLMARK_P53_PATHWAY to WebGestalt.