Basic information
- Phenotype
- HALLMARK_UV_RESPONSE_UP
- Description
- Enrichment score representing the genes increased in response to ultraviolet radiation. The score was calculated using ssGSEA on the RNA data (Z-score transformed coding genes with expression in at least 50% of the samples in a cohort).
- Source
- http://www.gsea-msigdb.org/gsea/msigdb/cards/HALLMARK_UV_RESPONSE_UP.html
- Method
- Single sample gene set enrichment analysis (ssGSEA) was performed for each cancer type using gene-wise Z-scores of the RNA expression data (RSEM) for the MSigDB Hallmark gene sets v7.0 (PMID: 26771021) via the ssGSEA2.0 R package (PMID: 30563849). RNA data were filtered to coding genes with < 50% 0 expression. (Parameters: sample.norm.type="rank", weight=0.75, statistic="area.under.RES", nperm=1000, min.overlap=10). Pathway activity scores are normalized enrichment scores from ssGSEA.
- Genes
-
- ACAA1
- AGO2
- ALAS1
- ALDOA
- AMD1
- AP2S1
- APOM
- AQP3
- ARRB2
- ASNS
- ATF3
- ATP6V1C1
- ATP6V1F
- BAK1
- BCL2L11
- BID
- BMP2
- BSG
- BTG1
- BTG2
- BTG3
- C4BPB
- CA2
- CASP3
- CCK
- CCND3
- CCNE1
- CDC34
- CDC5L
- CDK2
- CDKN1C
- CDKN2B
- CDO1
- CEBPG
- CHKA
- CHRNA5
- CLCN2
- CLTB
- CNP
- COL2A1
- CREG1
- CTSV
- CXCL2
- CYB5B
- CYB5R1
- CYP1A1
- DDX21
- DGAT1
- DLG4
- DNAJA1
- DNAJB1
- E2F5
- EIF2S3
- EIF5
- ENO2
- EPCAM
- EPHX1
- FEN1
- FGF18
- FKBP4
- FMO1
- FOS
- FOSB
- FURIN
- GAL
- GCH1
- GGH
- GLS
- GPX3
- GRINA
- GRPEL1
- H2AX
- HLA-F
- HMOX1
- HNRNPU
- HSPA13
- HSPA2
- HTR7
- HYAL2
- ICAM1
- IGFBP2
- IL6
- IL6ST
- IRF1
- JUNB
- KCNH2
- KLHDC3
- LHX2
- LYN
- MAOA
- MAPK8IP2
- MARK2
- MGAT1
- MMP14
- MRPL23
- MSX1
- NAT1
- NFKBIA
- NKX2-5
- NPTX2
- NPTXR
- NR4A1
- NTRK3
- NUP58
- NXF1
- OLFM1
- ONECUT1
- PARP2
- PDAP1
- PDLIM3
- PLCL1
- POLE3
- POLG2
- POLR2H
- PPAT
- PPIF
- PPP1R2
- PPT1
- PRKACA
- PRKCD
- PRPF3
- PSMC3
- PTPRD
- RAB27A
- RASGRP1
- RET
- RFC4
- RHOB
- RPN1
- RRAD
- RXRB
- SELENOW
- SHOX2
- SIGMAR1
- SLC25A4
- SLC6A12
- SLC6A8
- SOD2_ENSG00000285441
- SPR
- SQSTM1
- STARD3
- STIP1
- STK25
- SULT1A1
- TACR3
- TAP1
- TARS1
- TCHH
- TFRC
- TGFBRAP1
- TMBIM6
- TST
- TUBA4A
- TYRO3
- UROD
- WIZ
- YKT6
- More...
Gene association
Number of significant genes with P-value ≤ 10-6 for each cohorts are summarized in bar plots. The scatter plot highlights significant associations diven by protein rather than mRNA abundance.
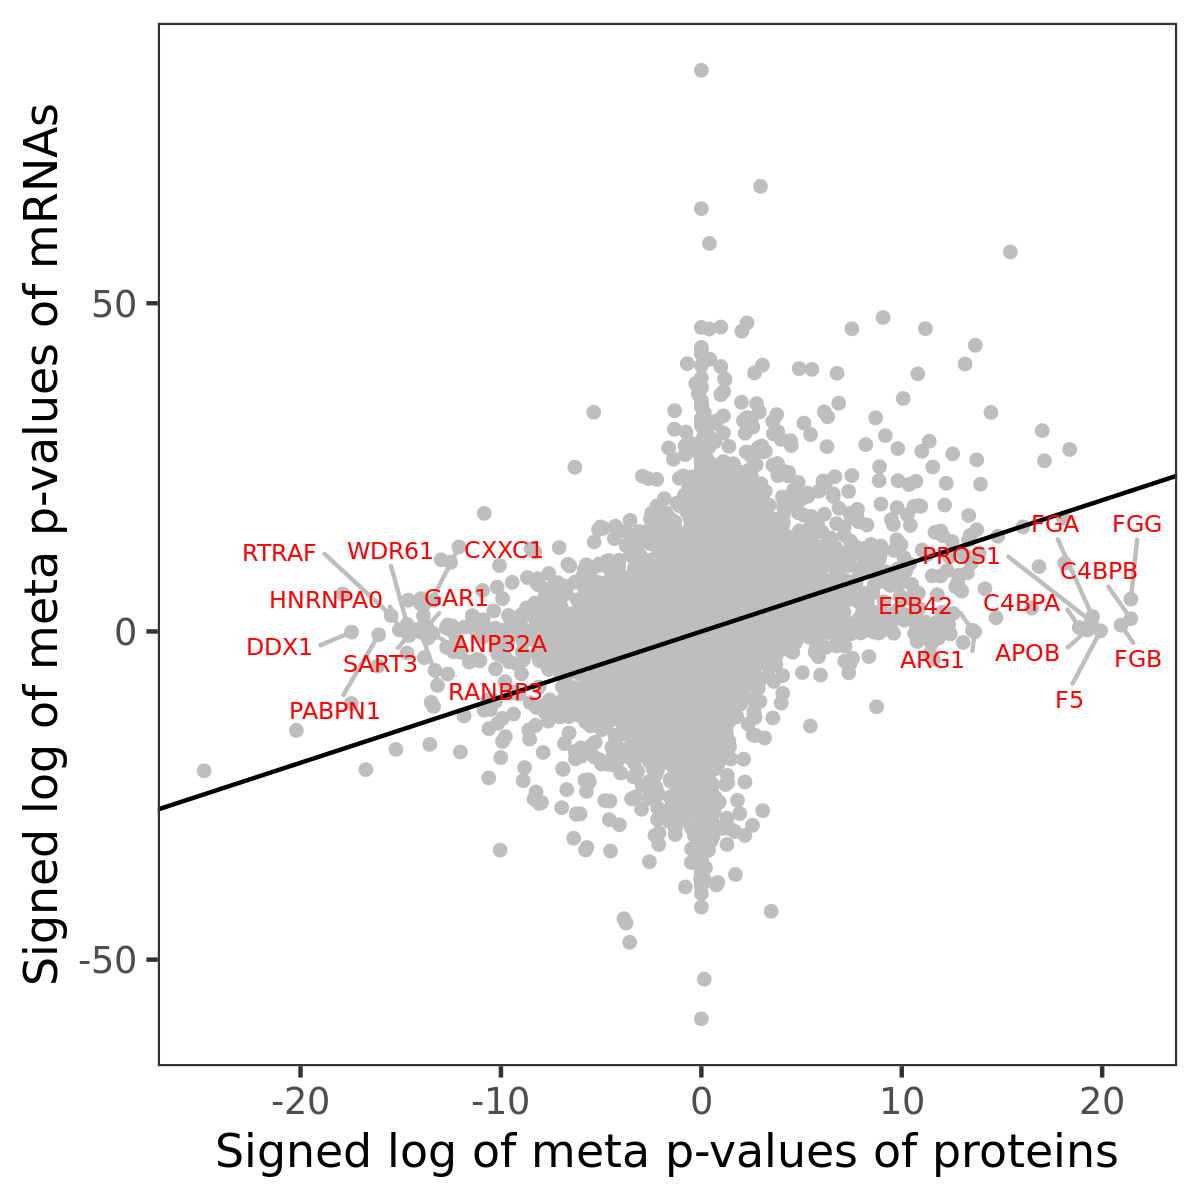
Association of protein abundance of genes
Signed p-values | ||||||||||||
|---|---|---|---|---|---|---|---|---|---|---|---|---|
Gene | Meta P | BRCA | CCRCC | COAD | GBM | HNSCC | LSCC | LUAD | OV | PDAC | UCEC | |
| No matching records found | ||||||||||||
Gene set enrichment analysis
Submit genes and the common logarithm of the p-values of their association with HALLMARK_UV_RESPONSE_UP to WebGestalt.
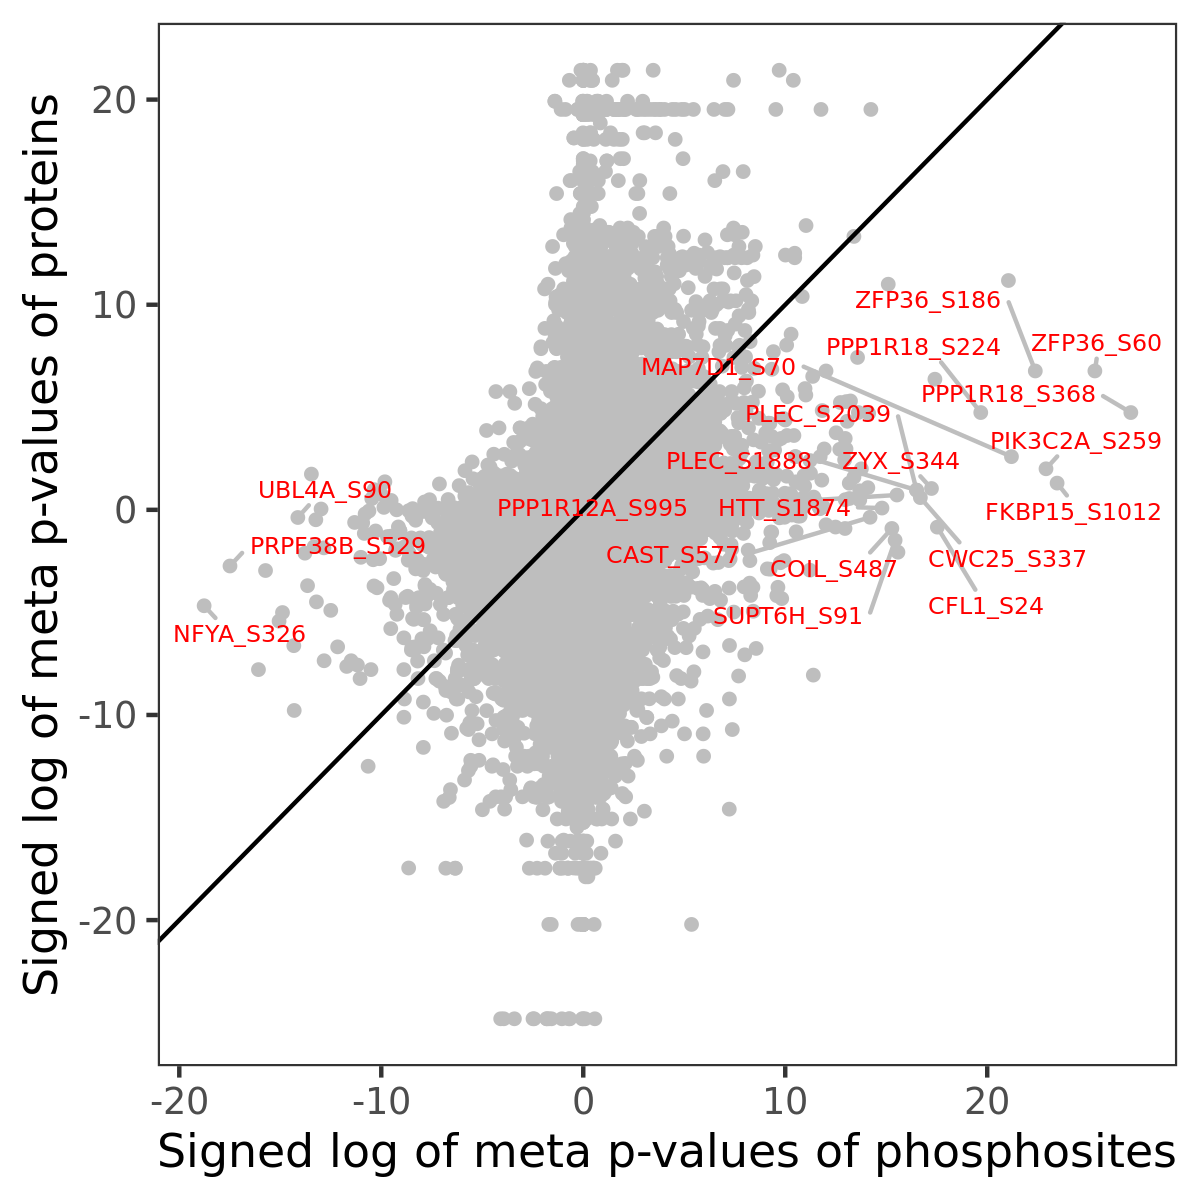
Phosphosite association
Number of significant genes with P-value ≤ 10-6 for each cohorts are summarized in the bar plot. The scatter plot highlights significant associations diven by phosphorylation rather than protein abundance.
Signed p-values | |||||||||||||
|---|---|---|---|---|---|---|---|---|---|---|---|---|---|
Gene | Protein | Site | Meta P | BRCA | CCRCC | COAD | GBM | HNSCC | LSCC | LUAD | OV | PDAC | UCEC |
| No matching records found | |||||||||||||
Gene set enrichment analysis
Submit phosphorylation sites and the common logarithm of the p-values of their association with HALLMARK_UV_RESPONSE_UP to WebGestalt.