Basic information
- Phenotype
- PROGENy: WNT
- Description
- Score representing the activity of the WNT pathway. It was calculated using the PROGENy tool on the RNA data (genes with mean FPKM expression >0).
- Source
- https://www.nature.com/articles/s41467-017-02391-6; https://www.sciencedirect.com/science/article/abs/pii/S1874939919302287?via%3Dihub
- Method
- The PROGENy scores were inferred using the R package progeny (V1.10.0) (PMID: 29295995) with default parameters using the RNA expression data (FPKM). Genes with mean expression = 0 in a cohort were removed from the analysis.
- Genes
-
- ALOX12
- ANGPT1
- ANKRD1
- ANO2
- APBB1
- ARL4C
- ASB4
- AVPR1A
- B3GNT2
- BMP4
- BMP7
- BNC1
- C2CD3
- C4BPB
- CACNA1E
- CAMK1D
- CD244
- CD48
- CLDN4
- CPLX2
- CSF3R
- CYP24A1
- DESI2
- DLX5
- EYA4
- FASLG
- FGD2
- FGF20
- FGF3
- FOXF1
- FOXJ2
- GFRA2
- Array
- GNAO1
- GNG11
- GPR22
- HIRA
- HOXB3
- HOXB5
- IGF1
- IL12RB1
- IL1RL1
- IRS1
- ITGB7
- KCNJ10
- KCNJ5
- KIF26B
- KLHL4
- KLK10
- KRT23
- LGALS14
- LPAR2
- LY86
- MSH3
- MSI1
- MSX1
- MSX2
- NCAM1
- NPY2R
- NTF3
- OLFM4
- PIEZO2
- PLA2R1
- PRDM5
- RAP2B
- RASGRP2
- RBMS2
- RNASEH2B
- RNF43
- RUBCNL
- SBSPON
- SEC31B
- SEL1L3
- SFRP5
- SIGLEC6
- SLC7A8
- SNCAIP
- SNTB1
- SYK
- SYT12
- TCTN2
- TDRKH
- TLE4
- TPH1
- TRMT2B
- TSHZ2
- UPK1B
- WFDC2
- ZFP30
- ZNF230
- ZNF385D
- ZNF43
- ZNF45
- ZNF552
- ZNF613
- ZNF701
- More...
Gene association
Number of significant genes with P-value ≤ 10-6 for each cohorts are summarized in bar plots. The scatter plot highlights significant associations diven by protein rather than mRNA abundance.
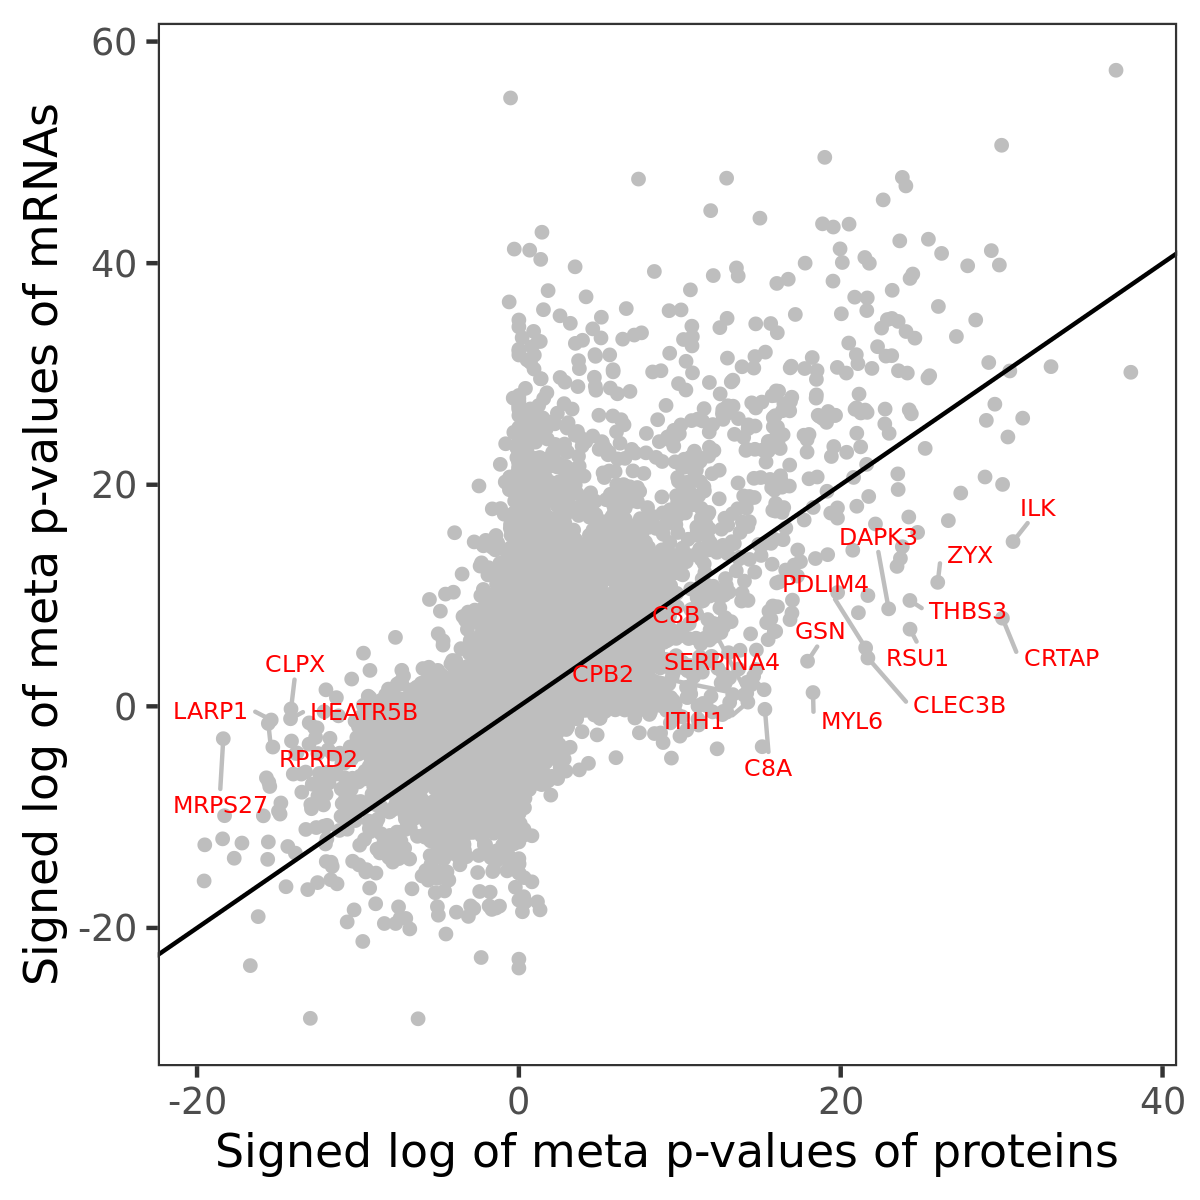
Association of protein abundance of genes
| Signed p-values | |||||||||||
|---|---|---|---|---|---|---|---|---|---|---|---|
| Gene | Meta P | BRCA | CCRCC | COAD | GBM | HNSCC | LSCC | LUAD | OV | PDAC | UCEC |
Gene set enrichment analysis
Submit genes and the common logarithm of the p-values of their association with PROGENy: WNT to WebGestalt.
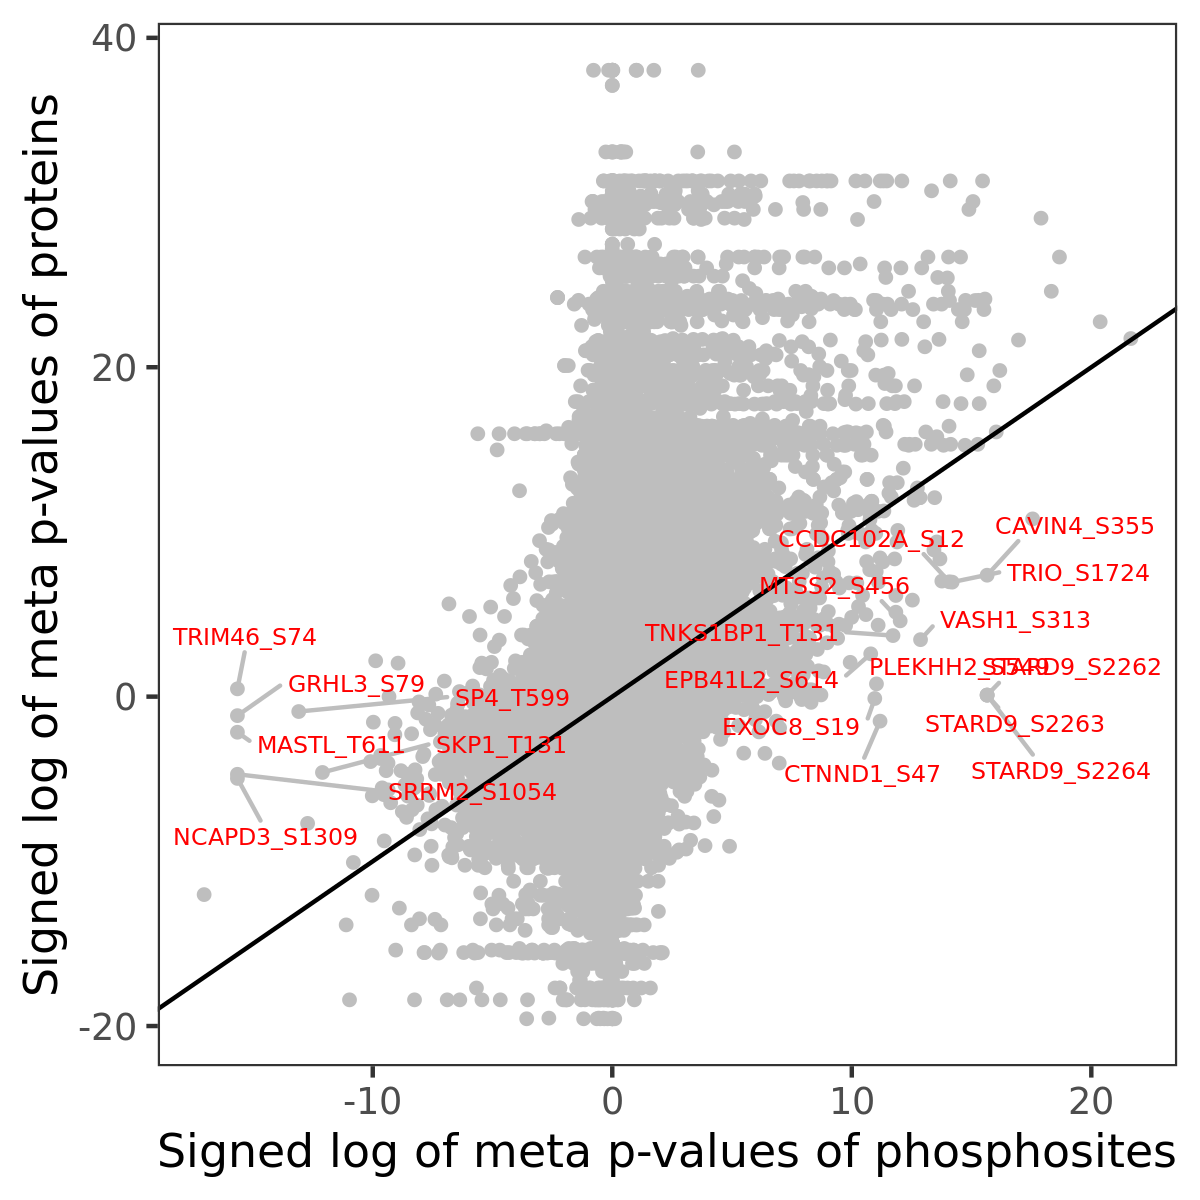
Phosphosite association
Number of significant genes with P-value ≤ 10-6 for each cohorts are summarized in the bar plot. The scatter plot highlights significant associations diven by phosphorylation rather than protein abundance.
| Signed p-values | |||||||||||||
|---|---|---|---|---|---|---|---|---|---|---|---|---|---|
| Gene | Protein | Site | Meta P | BRCA | CCRCC | COAD | GBM | HNSCC | LSCC | LUAD | OV | PDAC | UCEC |
Gene set enrichment analysis
Submit phosphorylation sites and the common logarithm of the p-values of their association with PROGENy: WNT to WebGestalt.