Basic information
- Phenotype
- cibersort: B cell plasma
- Description
- Estimated fraction of plasma B cells in the tumor compared to 21 other immune cells defined by CIBERSORT based on RNA expression data.
- Source
- https://www.nature.com/articles/nmeth.3337
- Method
- The R package immunedeconv (V2.0.4) (PMID: 31510660) was used to perform immune cell deconvolution using RNA expression data (TPM). CIBERSORT (PMID: 25822800) was performed in the ‘abs’ mode.
- Genes
-
- ACP5
- AIM2
- APOBEC3G
- APOL3
- C11orf80
- CCND2
- CCR10
- CCR2
- CD180
- CD19
- CD37
- CD3E
- CD40
- CD70
- CD79B
- CHST15
- CYP27B1
- FCRL2
- Array
- Array
- GNG7
- Array
- AMPD1
- BHLHE41
- BIRC3
- BRAF
- CD1A
- CD2
- CD27
- CD38
- CD4
- CD5
- CD79A
- CD80
- CPA3
- EAF2
- ETS1
- FCGR2B
- FOSB
- FPR1
- HLA-DOB
- IDO1
- IGHD
- IL2RB
- Array
- KCNA3
- KLRG1
- LIME1
- LRMP
- LY86
- LY9
- MAN1A1
- MANEA
- MAST1
- MMP9
- MS4A1
- Array
- MZB1
- Array
- NIPSNAP3B
- NPIPB15
- Array
- P2RX5
- P2RY10
- PASK
- PBXIP1
- PDK1
- PIK3IP1
- PNOC
- PSG2
- PTPRCAP
- Array
- QPCT
- RASGRP3
- REN
- RGS1
- RNASE2
- RNASE6
- RRP12
- SAMSN1
- SELL
- SIK1
- SIT1
- SKAP1
- SLAMF1
- SP140
- SPAG4
- SPOCK2
- ST6GALNAC4
- STAP1
- TBX21
- TCL1A
- TGM5
- TMEM156
- TNFRSF13B
- TNFRSF17
- VPREB3
- ZBP1
- ZFP36L2
- More...
Gene association
Number of significant genes with P-value ≤ 10-6 for each cohorts are summarized in bar plots. The scatter plot highlights significant associations diven by protein rather than mRNA abundance.
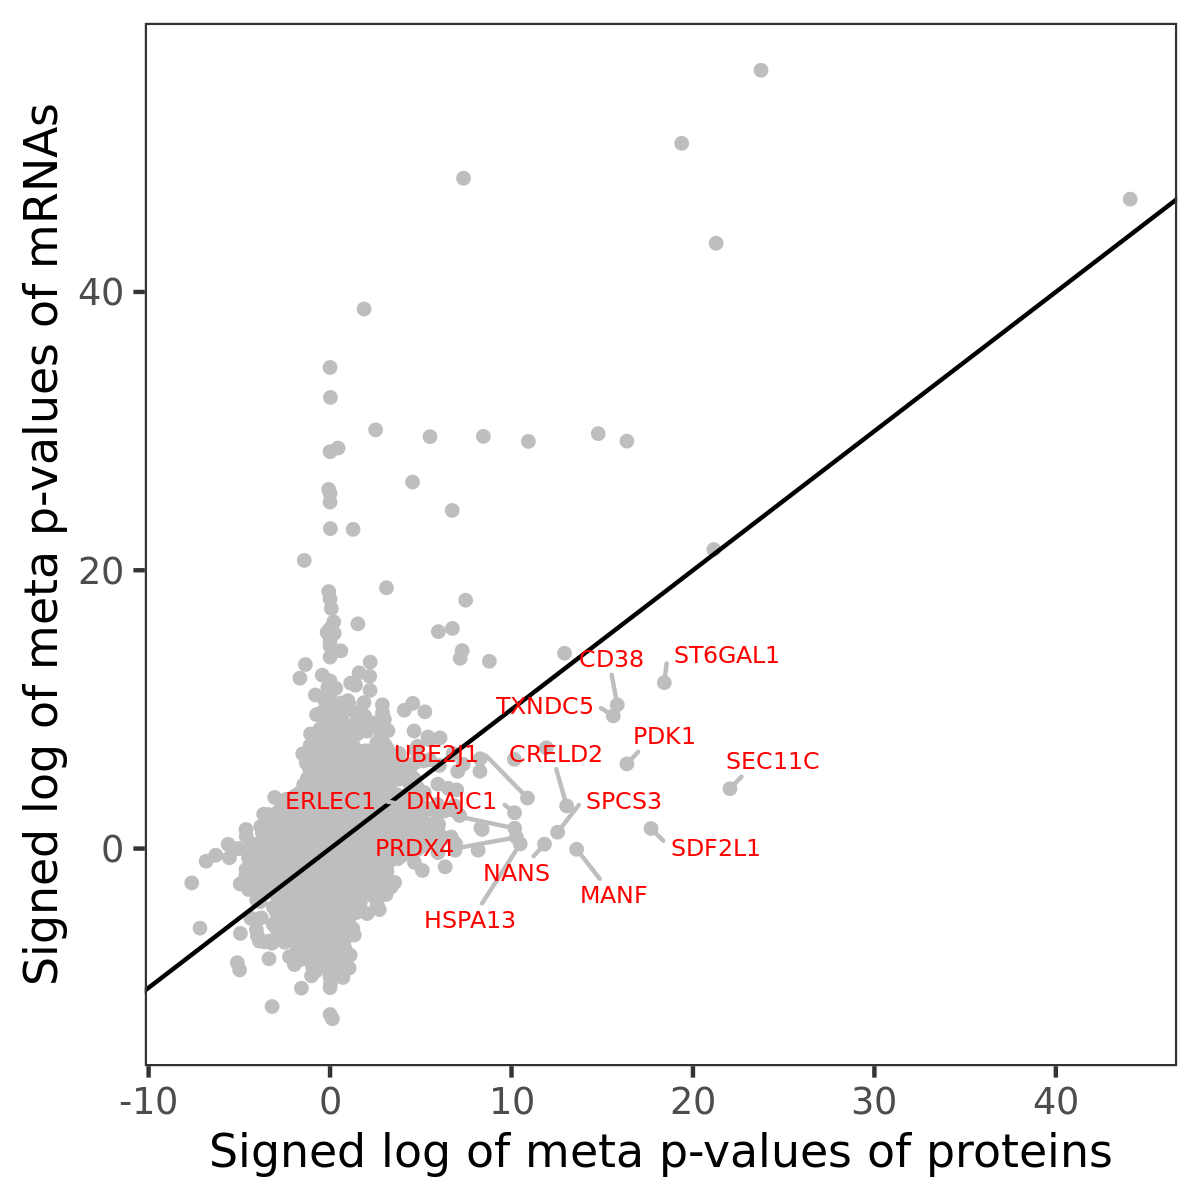
Association of protein abundance of genes
| Signed p-values | |||||||||||
|---|---|---|---|---|---|---|---|---|---|---|---|
| Gene | Meta P | BRCA | CCRCC | COAD | GBM | HNSCC | LSCC | LUAD | OV | PDAC | UCEC |
Gene set enrichment analysis
Submit genes and the common logarithm of the p-values of their association with cibersort: B cell plasma to WebGestalt.
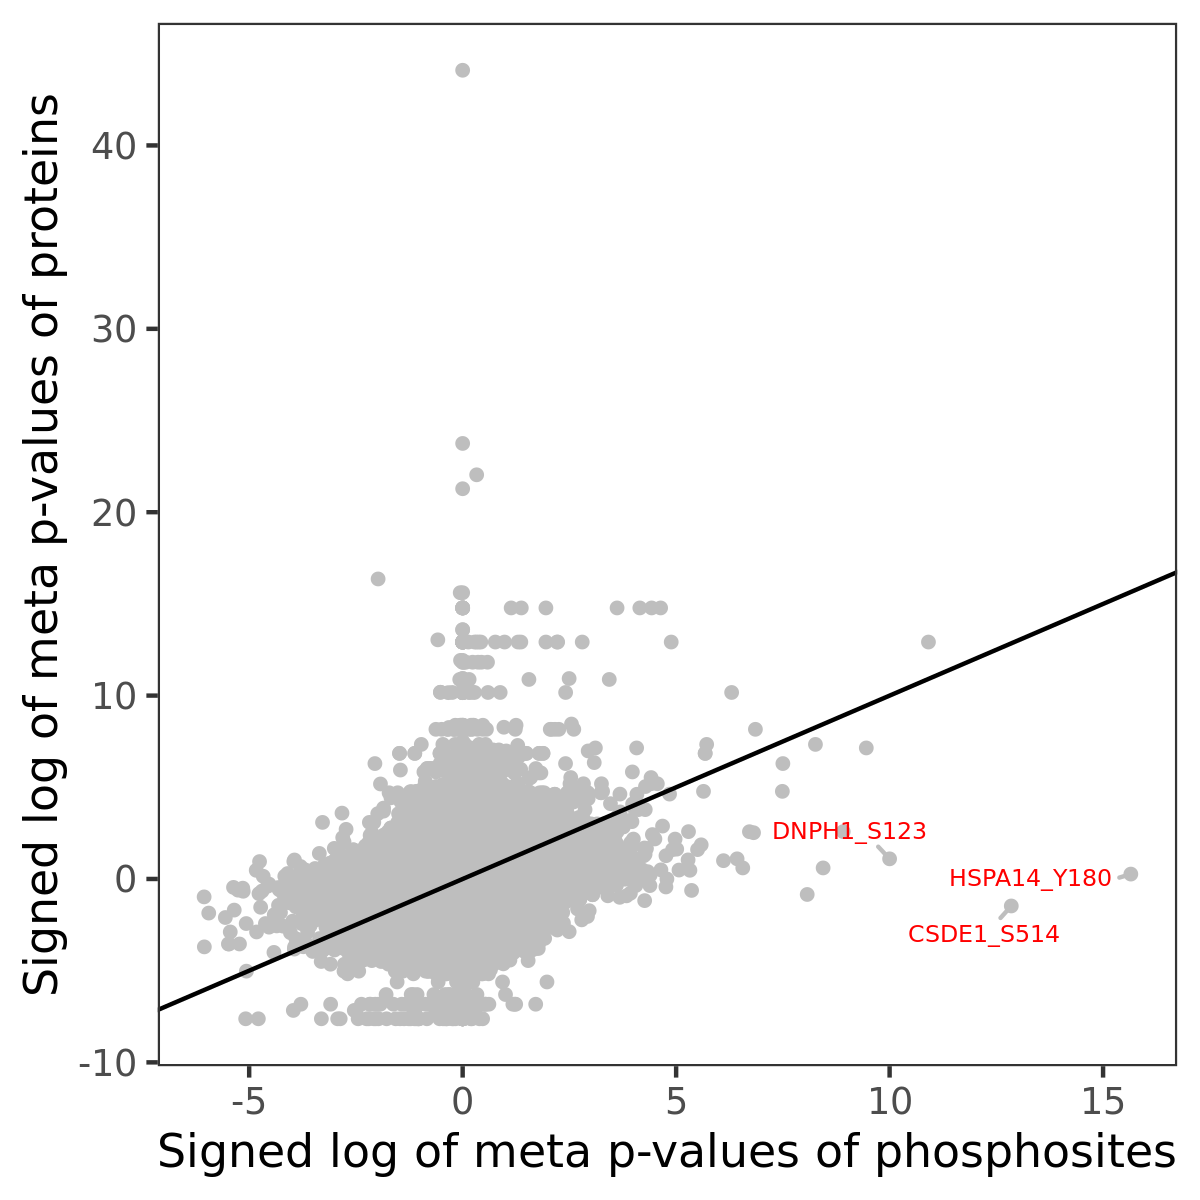
Phosphosite association
Number of significant genes with P-value ≤ 10-6 for each cohorts are summarized in the bar plot. The scatter plot highlights significant associations diven by phosphorylation rather than protein abundance.
| Signed p-values | |||||||||||||
|---|---|---|---|---|---|---|---|---|---|---|---|---|---|
| Gene | Protein | Site | Meta P | BRCA | CCRCC | COAD | GBM | HNSCC | LSCC | LUAD | OV | PDAC | UCEC |
Gene set enrichment analysis
Submit phosphorylation sites and the common logarithm of the p-values of their association with cibersort: B cell plasma to WebGestalt.