Basic information
- Phenotype
- xcell: B cell
- Description
- Enrichment score inferring the proportion of B cells in the tumor derived from RNA data using the xCell tool.
- Source
- https://genomebiology.biomedcentral.com/articles/10.1186/s13059-017-1349-1
- Method
- The R package immunedeconv (V2.0.4) (PMID: 31510660) was used to perform immune cell deconvolution using RNA expression data (TPM).
- Genes
-
- AFF2
- AFTPH
- AICDA
- ANKMY1
- AP3B1
- ARHGAP17
- ATF7IP
- BAIAP3
- BCL2L11
- BLK
- BMP8B
- BTK
- C12orf49
- C5orf15
- CCR6
- CD180
- CD19
- CD22
- CD37
- CD53
- CD72
- CD79A
- CD79B
- CDC40
- CEACAM21
- CEPT1
- CHAD
- CIITA
- CNOT1
- CNR1
- CNR2
- COL19A1
- CR1
- CSNK1G3
- CXCR5
- DAXX
- DCLRE1C
- DEF8
- DEPDC5
- DNASE1
- FCRL2
- GDI2
- GGA2
- GPR18
- GPR25
- GPRC5D
- HDAC7
- HLA-DOA
- HLA-DPB1
- HSPA4
- HTR3A
- IFNA2
- IFNW1
- IKZF3
- IL17A
- INPP5B
- ITSN2
- JMJD1C
- KCNIP2
- KCNN3
- LSM6
- LY86
- LY9
- MAP3K9
- MBD4
- MCM9
- MFN1
- MGAT5
- MIOS
- MMP17
- MRM1
- MS4A1
- MYOT
- NSUN5
- NUP160
- P2RY10
- PAX5
- PGR
- PHKB
- PIKFYVE
- PLA2G2D
- PNOC
- POLR3K
- POU2F1
- POU2F2
- PRDM2
- PRDM4
- PRKCB
- PWP1
- QRSL1
- RECQL5
- RIC3
- RNGTT
- Array
- RPS11
- Array
- RPS16
- RRAS2
- S1PR2
- S1PR4
- SEC62
- SIPA1L3
- SLC13A2
- SLC24A1
- SLC30A4
- SMC6
- SNX2
- SP140
- SPIB
- STAG3
- STAP1
- SYPL1
- TCL1A
- TCL1B
- TERT
- TLR7
- TNFRSF13B
- TNFRSF17
- TRAF3
- UBE2G1
- UTP6
- VPREB3
- WDR11
- ZNF154
- ZNF202
- ZNF208
- ZNF37A
- ZNF638
- ZNF688
- ZNF701
- More...
Gene association
Number of significant genes with P-value ≤ 10-6 for each cohorts are summarized in bar plots. The scatter plot highlights significant associations diven by protein rather than mRNA abundance.
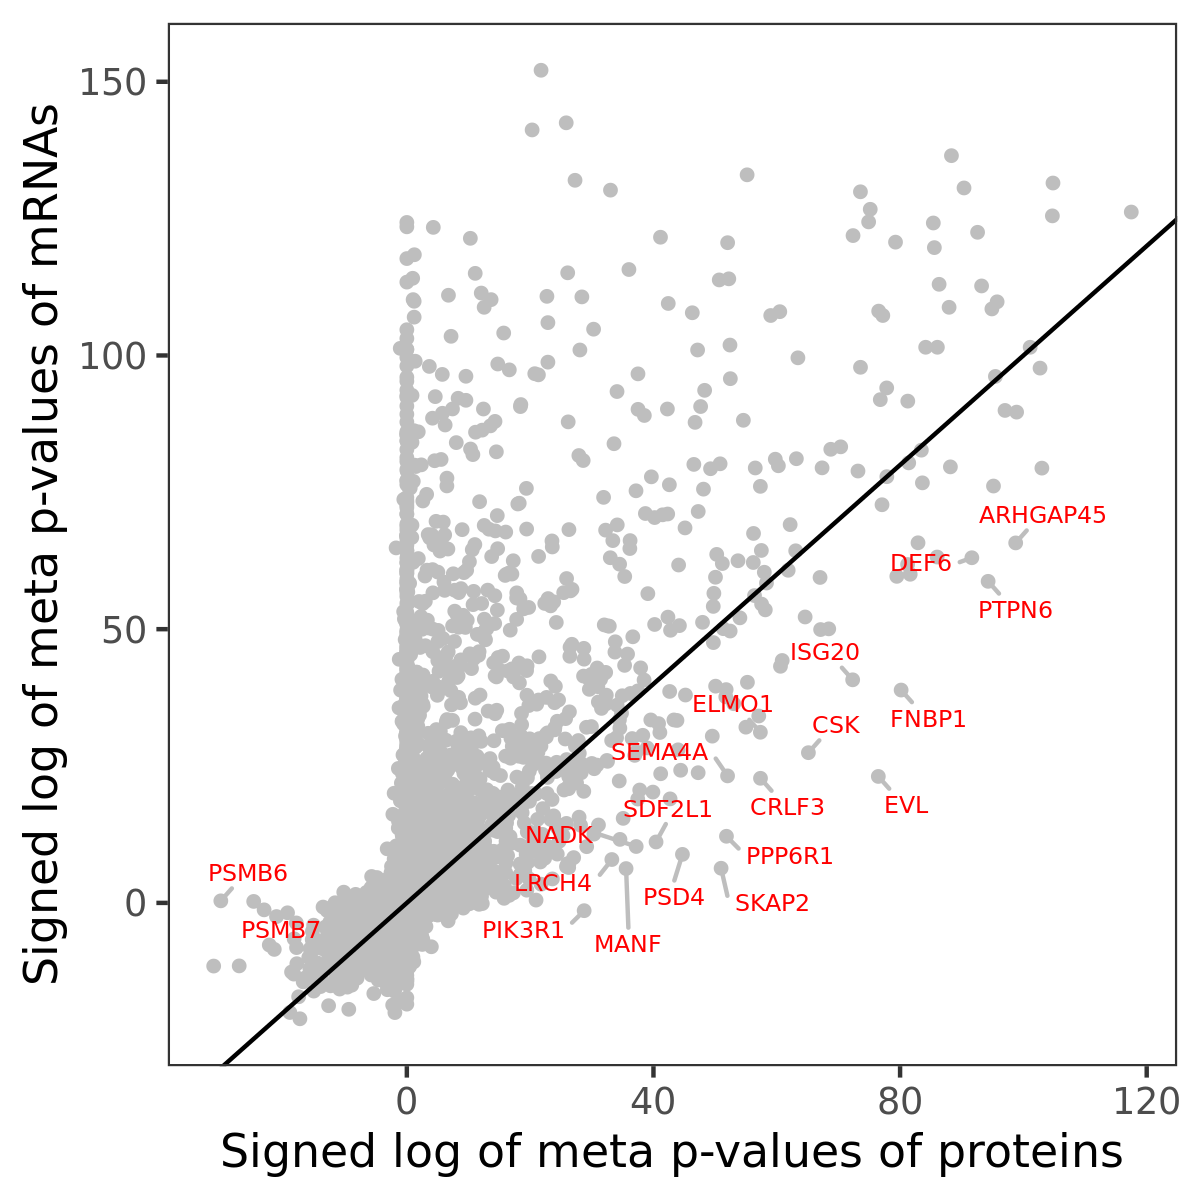
Association of protein abundance of genes
| Signed p-values | |||||||||||
|---|---|---|---|---|---|---|---|---|---|---|---|
| Gene | Meta P | BRCA | CCRCC | COAD | GBM | HNSCC | LSCC | LUAD | OV | PDAC | UCEC |
Gene set enrichment analysis
Submit genes and the common logarithm of the p-values of their association with xcell: B cell to WebGestalt.
Phosphosite association
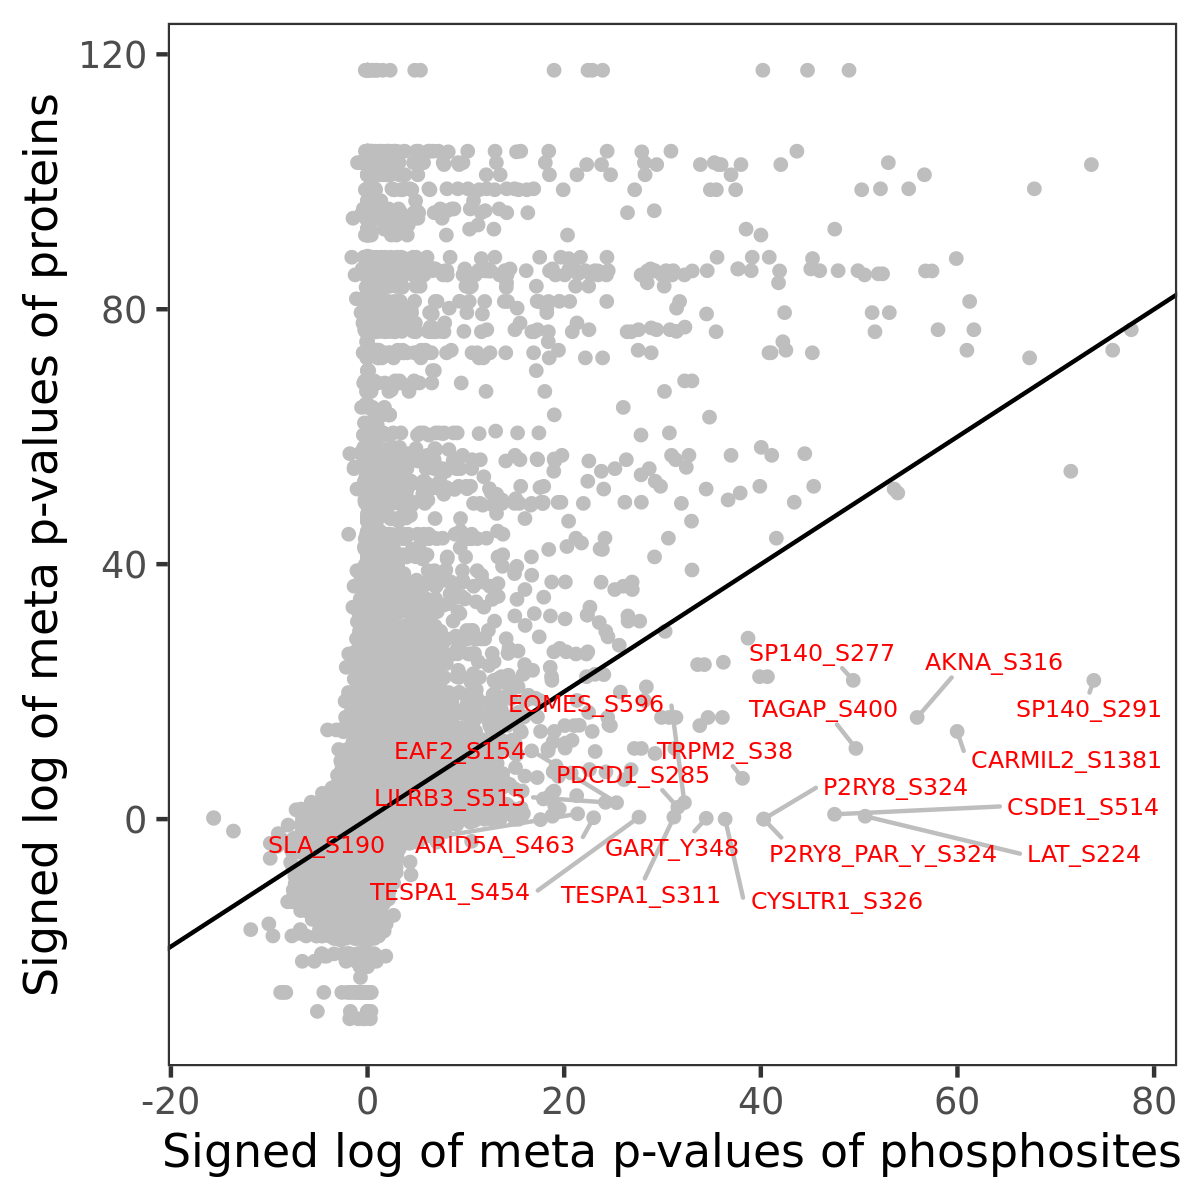
Number of significant genes with P-value ≤ 10-6 for each cohorts are summarized in the bar plot. The scatter plot highlights significant associations diven by phosphorylation rather than protein abundance.
| Signed p-values | |||||||||||||
|---|---|---|---|---|---|---|---|---|---|---|---|---|---|
| Gene | Protein | Site | Meta P | BRCA | CCRCC | COAD | GBM | HNSCC | LSCC | LUAD | OV | PDAC | UCEC |
Gene set enrichment analysis
Submit phosphorylation sites and the common logarithm of the p-values of their association with xcell: B cell to WebGestalt.