Basic information
- Phenotype
- xcell: B cell plasma
- Description
- Enrichment score inferring the proportion of plasma B cells in the tumor derived from RNA data using the xCell tool.
- Source
- https://genomebiology.biomedcentral.com/articles/10.1186/s13059-017-1349-1
- Method
- The R package immunedeconv (V2.0.4) (PMID: 31510660) was used to perform immune cell deconvolution using RNA expression data (TPM).
- Genes
-
- ACBD3
- ACBD4
- ADM2
- AIPL1
- ALG5
- ALG9
- ALPI
- AMPD1
- APOA1
- APOC3
- ARHGEF16
- ARL1
- ARSA
- ATF6
- AUP1
- AVIL
- AVP
- B4GALT3
- BFSP2
- BMP8B
- C16orf58
- C19orf73
- CA7
- CACNA1S
- CAMP
- CASP10
- CAV1
- CCDC121
- CCDC33
- CCDC40
- CCDC88A
- CCL25
- CCNC
- CD180
- CD19
- CD27
- CD79A
- CD79B
- CDH15
- CEACAM21
- CELA2B
- CHRNA4
- CHRNG
- CHST8
- CLCNKB
- CLINT1
- CNKSR1
- CNPY2
- CNR1
- CNTD2
- COX6A2
- CRYBA4
- CRYBB1
- CRYBB3
- CRYGC
- CSHL1
- CSPP1
- CUL7
- CUX2
- CYBA
- CYP11A1
- DAD1
- DDN
- DDOST
- DEF8
- DKKL1
- DMTF1
- DNAJC4
- DNASE1L2
- DOK3
- DPAGT1
- DRD4
- DRD5
- EBAG9
- ELL
- ENTPD1
- EPO
- ERGIC3
- FBP2
- FCRL2
- FGF6
- FKBP2
- FN3K
- FNDC3A
- FTCD
- GABRR2
- GDF2
- GH2
- GLT8D1
- GMPPA
- GNB3
- GOLGA3
- GOLGA4
- GOLGB1
- GORASP2
- GP9
- GPLD1
- GPR37L1
- GPRC5D
- GRIN1
- GRM4
- GRWD1
- GUCA1A
- GUCA1A_ENSG00000048545
- HAND2
- HDLBP
- HEYL
- HOOK2
- HSF4
- HSP90B1
- HSPA6
- IDE
- IFT52
- IGF1
- IMP4
- IRF4
- IRGC
- ISCU
- ITGA8
- KCNN3
- KCNQ4
- KDELR2
- KLC2
- KLF15
- KNTC1
- KRT10
- LAX1
- LBX1
- LEFTY2
- LMAN1L
- LMAN2
- LTB4R2
- MAGEF1
- MANF
- MAPK8IP3
- MAST1
- MATN4
- MBTPS1
- MCTS1
- MGAT2
- MIA3
- MIS12
- MRPS31
- MTDH
- MYH13
- MYL2
- MYL7
- NDOR1
- NEUROG1
- NGLY1
- NOS2
- NPAS1
- NPPA
- NPPC
- NTRK1
- OGFOD2
- P2RY4
- PABPC4
- PCDHA5
- PDE6A
- PDIA2
- PDIA6
- PHOX2A
- PICK1
- PNOC
- POMC
- POU3F3
- PPIB
- PPIL2
- PRDM14
- PRDX4
- PREB
- PRM1
- PRX
- PTGER1
- PTPRS
- R3HCC1
- RAB3A
- RAD17
- RALY
- RASIP1
- RAX
- RFX2
- RGS1
- RGS13
- RNF103
- RNF113A
- RNF208
- RNGTT
- RPN1
- RPN2
- SAP30BP
- SCFD1
- SEC24A
- SEC61A1
- SEC61B
- SEC61G
- SEC62
- SEC63
- SEMA6C
- SERP1
- SHANK1
- SHBG
- SIPA1L3
- SIX5
- SLC13A2
- SLC35B1
- SLC35C2
- SLC38A10
- SLC5A2
- SLC6A13
- SLCO5A1
- SMPD2
- SNAPC4
- SPATS2
- SPCS1
- SRP54
- SRPRB
- SS18
- SSR1
- SSR4
- STMN4
- SURF1
- SYT5
- TBL2
- TBX4
- TCF3
- TERT
- TG
- THAP4
- TIMM17B
- TM9SF1
- TMED10
- TMED9
- TMEM39A
- TMEM59
- TNFRSF13B
- TNFRSF17
- TNNT3
- TP73
- TRABD
- TREH
- TSHR
- TSSK2
- UBA5
- UBE2G1
- UBXN4
- UFSP2
- UGGT1
- USP48
- UTF1
- VPREB1
- VPREB3
- VSX1
- WDR45
- WNT1
- YIPF1
- YIPF2
- ZBP1
- ZDHHC4
- ZNF133
- ZNF142
- ZNF37A
- ZPBP
- More...
Gene association
Number of significant genes with P-value ≤ 10-6 for each cohorts are summarized in bar plots. The scatter plot highlights significant associations diven by protein rather than mRNA abundance.
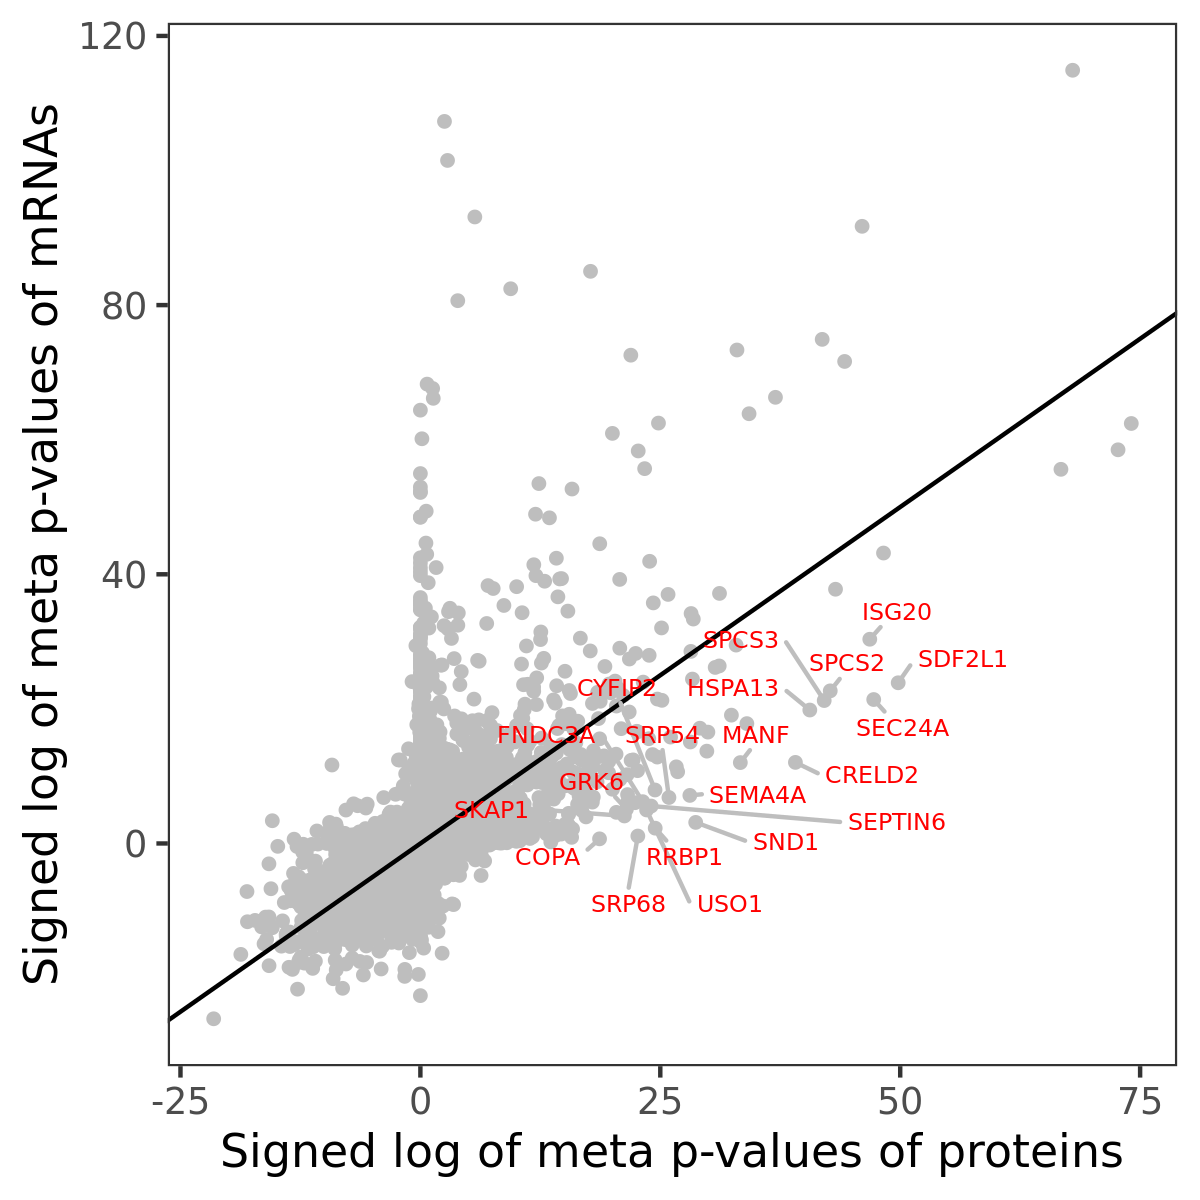
Association of protein abundance of genes
| Signed p-values | |||||||||||
|---|---|---|---|---|---|---|---|---|---|---|---|
| Gene | Meta P | BRCA | CCRCC | COAD | GBM | HNSCC | LSCC | LUAD | OV | PDAC | UCEC |
Gene set enrichment analysis
Submit genes and the common logarithm of the p-values of their association with xcell: B cell plasma to WebGestalt.
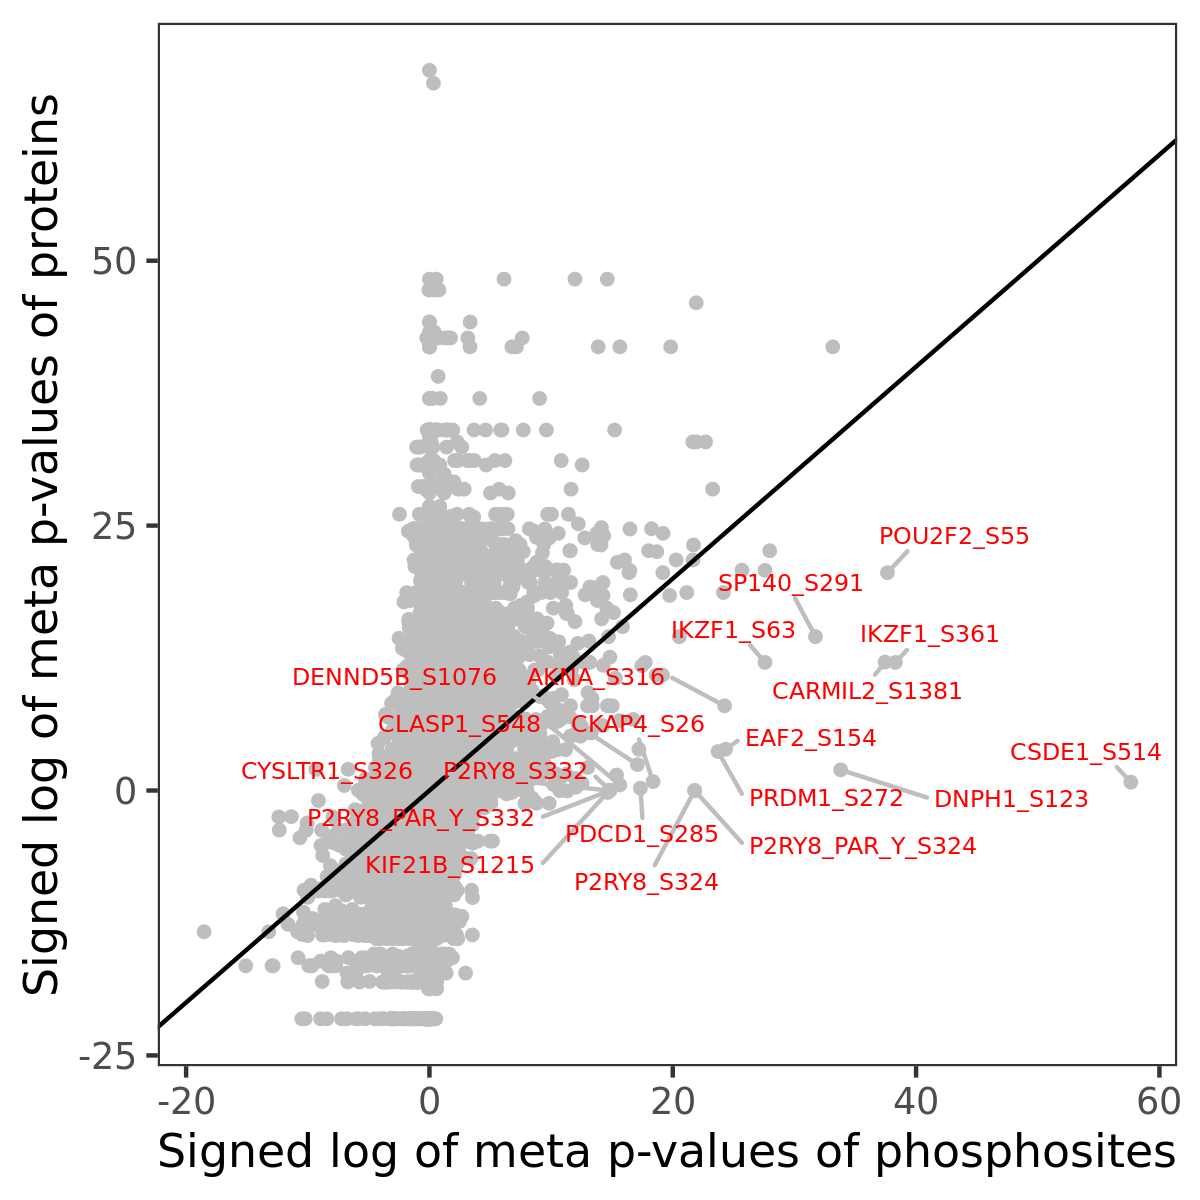
Phosphosite association
Number of significant genes with P-value ≤ 10-6 for each cohorts are summarized in the bar plot. The scatter plot highlights significant associations diven by phosphorylation rather than protein abundance.
| Signed p-values | |||||||||||||
|---|---|---|---|---|---|---|---|---|---|---|---|---|---|
| Gene | Protein | Site | Meta P | BRCA | CCRCC | COAD | GBM | HNSCC | LSCC | LUAD | OV | PDAC | UCEC |
Gene set enrichment analysis
Submit phosphorylation sites and the common logarithm of the p-values of their association with xcell: B cell plasma to WebGestalt.