Basic information
- Phenotype
- xcell: Eosinophil
- Description
- Enrichment score inferring the proportion of eosinophils in the tumor derived from RNA data using the xCell tool.
- Source
- https://genomebiology.biomedcentral.com/articles/10.1186/s13059-017-1349-1
- Method
- The R package immunedeconv (V2.0.4) (PMID: 31510660) was used to perform immune cell deconvolution using RNA expression data (TPM).
- Genes
-
- ADAM18
- ADAM21
- ADORA3
- AGTR2
- ALOX15
- AP4E1
- ARHGAP33
- ASPA
- ATOH1
- BMX
- BPI
- C3AR1
- CA4
- CAMP
- CCL23
- CCR1
- CCR3
- CD101
- CDH19
- CEACAM8
- CEBPE
- CLC
- CORO7
- CSF2RB
- CUX2
- CYSLTR2
- DEFA4
- DPEP2
- DPEP3
- DRP2
- ENTPD2
- EPN2
- FBXO40
- FCER1A
- FEV
- FMO3
- GAST
- GIPR
- GMIP
- HDC
- HIC1
- HRH4
- HS3ST2
- IL5RA
- KCNA5
- KCNK7
- KDM6B
- KIF5A
- KSR1
- LECT2
- LMTK2
- LRRC36
- LTF
- MBOAT7
- MMP25
- MMP26
- MMRN2
- MNT
- MOG
- MS4A3
- MYO3A
- NPY2R
- NXPH3
- NYX
- OLIG2
- P2RY14
- PGLYRP1
- PHLDA2
- PLXNB3
- POLQ
- PRL
- PTTG2
- PURG
- RARA
- RASL12
- RGS13
- SETD1B
- SIGLEC8
- SLC19A1
- SRRM2
- STATH
- SYCP1
- TACSTD2
- TNFSF11
- TRIM48
- TRPM6
- ZNF197
- More...
Gene association
Number of significant genes with P-value ≤ 10-6 for each cohorts are summarized in bar plots. The scatter plot highlights significant associations diven by protein rather than mRNA abundance.
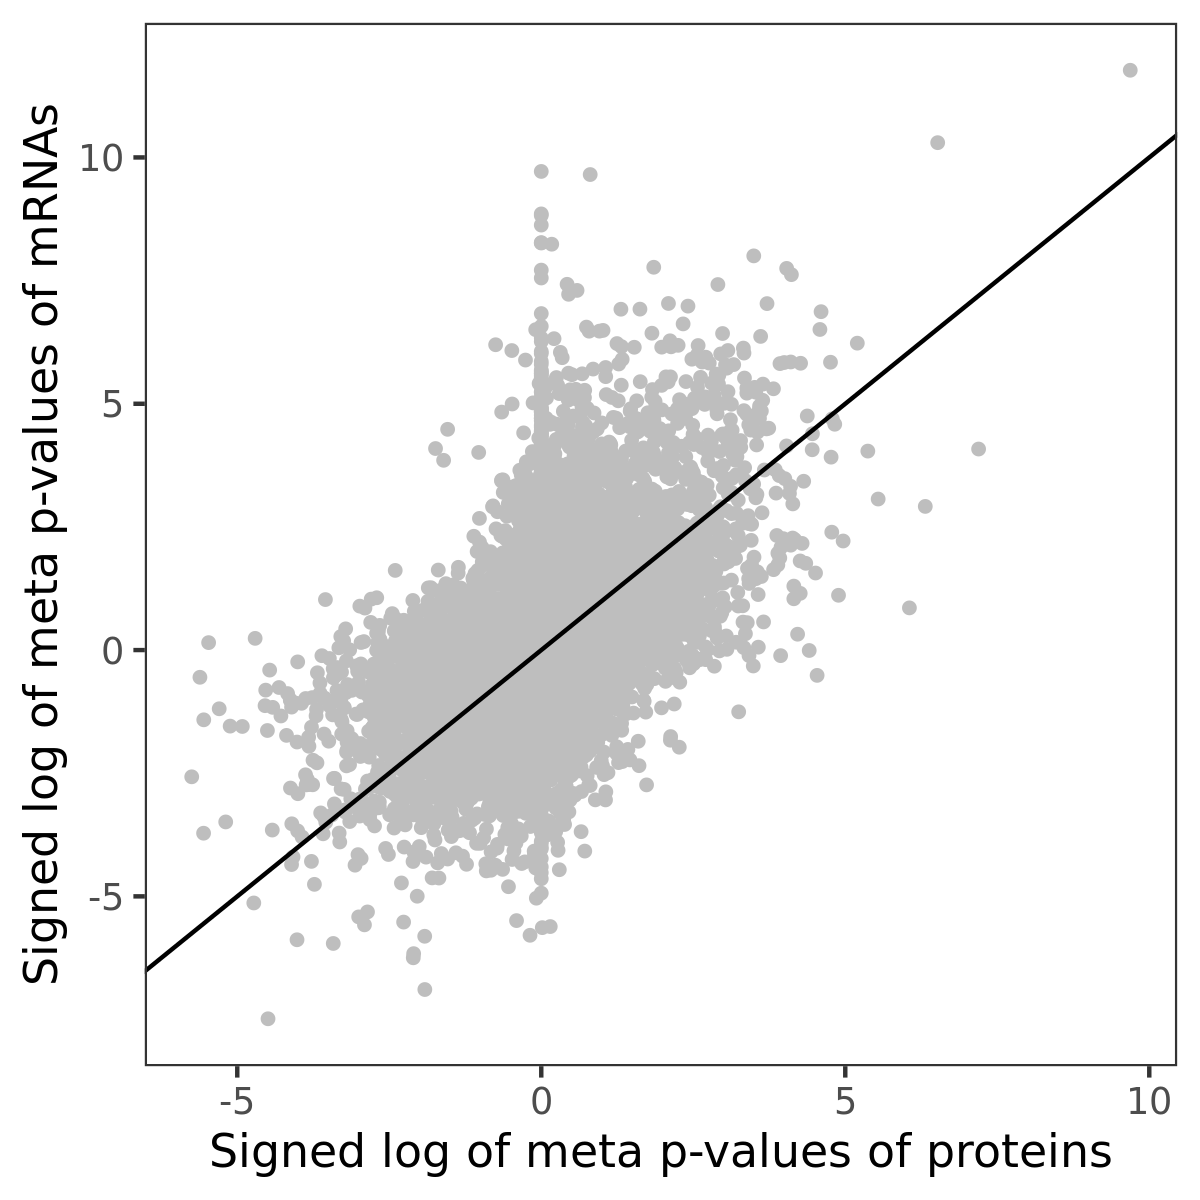
Association of protein abundance of genes
| Signed p-values | |||||||||||
|---|---|---|---|---|---|---|---|---|---|---|---|
| Gene | Meta P | BRCA | CCRCC | COAD | GBM | HNSCC | LSCC | LUAD | OV | PDAC | UCEC |
Gene set enrichment analysis
Submit genes and the common logarithm of the p-values of their association with xcell: Eosinophil to WebGestalt.
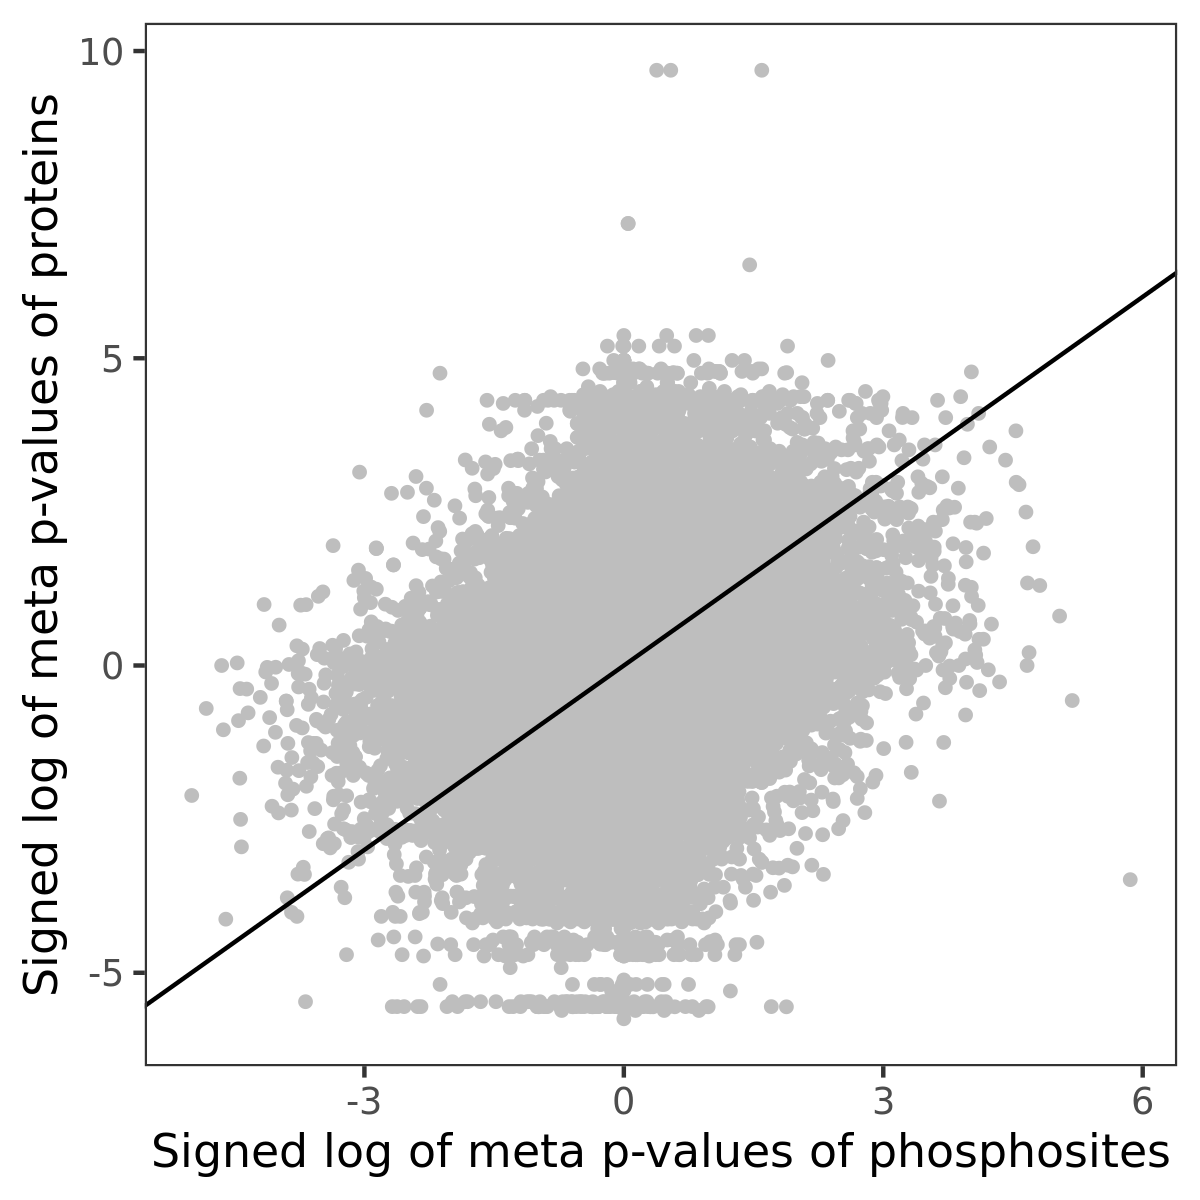
Phosphosite association
Number of significant genes with P-value ≤ 10-6 for each cohorts are summarized in the bar plot. The scatter plot highlights significant associations diven by phosphorylation rather than protein abundance.
| Signed p-values | |||||||||||||
|---|---|---|---|---|---|---|---|---|---|---|---|---|---|
| Gene | Protein | Site | Meta P | BRCA | CCRCC | COAD | GBM | HNSCC | LSCC | LUAD | OV | PDAC | UCEC |
Gene set enrichment analysis
Submit phosphorylation sites and the common logarithm of the p-values of their association with xcell: Eosinophil to WebGestalt.