Basic information
- Phenotype
- xcell: Macrophage M2
- Description
- Enrichment score inferring the proportion of M2 macrophages in the tumor derived from RNA data using the xCell tool.
- Source
- https://genomebiology.biomedcentral.com/articles/10.1186/s13059-017-1349-1
- Method
- The R package immunedeconv (V2.0.4) (PMID: 31510660) was used to perform immune cell deconvolution using RNA expression data (TPM).
- Genes
-
- ACP2
- ACSM5
- ADAMDEC1
- ADCY3
- ADRA2B
- AGGF1
- AKR7A2
- ALDH9A1
- ALG9
- ALK
- ANGPT4
- ANKFY1
- ANXA11
- AP1B1
- AQP8
- ARFGEF2
- ARHGEF11
- ARSB
- ATP2A2
- ATP6V0A1
- ATP6V0D1
- ATP6V1C1
- ATP6V1D
- BAIAP2
- BCAP31
- BTBD1
- CAMP
- CANX
- CARD14
- CCDC85C
- CCDC88A
- CD52
- CD63
- CD81
- CDS2
- CEPT1
- CLCN7
- COMMD9
- CYFIP1
- DHX57
- DNASE1L3
- DNASE2B
- EFR3A
- ELK1
- EXOC1
- FDX1
- FGR
- FH
- FKBP15
- FLT1
- FTL
- GABARAP
- GGA1
- GLB1
- GORASP1
- GPD1
- GSTO1
- GUCA1A
- GUCA1A_ENSG00000048545
- HADHB
- HAMP
- HEXA
- HEXB
- HPS1
- HS3ST2
- HSPH1
- IARS2
- IFNAR1
- IPPK
- ITGAX
- KCNJ1
- KCNJ5
- KCNK13
- KCTD5
- LAIR1
- LAMP1
- LILRA2
- LILRB4
- LONRF3
- MARCO
- MFN1
- MMP19
- MRM1
- MS4A4A
- MSR1
- MTMR14
- MYO15A
- MYO9B
- MYOZ1
- NAGPA
- NCAPH
- NCKAP1L
- NDUFB1
- NFS1
- NOP10
- NPR1
- OS9
- OSBPL11
- P2RX7
- PABPC4
- PDCD6IP
- PDE1B
- PEX19
- PICK1
- PLEKHM2
- POGK
- RIN2
- S100A6
- SCAMP2
- SDCBP
- SDS
- SLAMF8
- SLC25A24
- SLC25A46
- SLC31A1
- SLC38A7
- SLC39A1
- SLC6A12
- SLC6A7
- SLC9A6
- SMG5
- SNAPC2
- SNX1
- SNX2
- SNX3
- SNX5
- SPG21
- STX18
- STX4
- TAF10
- TBC1D9B
- TFEC
- TMED5
- TMEM184C
- TMEM70
- TMEM9B
- TNFSF14
- TPP1
- TREM2
- TSPO
- UBXN6
- UCP3
- UGP2
- UNC50
- USF2
- VPS35
- VPS53
- VSIG4
- VTI1B
- WDFY3
- XPNPEP2
- ZC3H3
- ZCCHC4
- ZNF219
- More...
Gene association
Number of significant genes with P-value ≤ 10-6 for each cohorts are summarized in bar plots. The scatter plot highlights significant associations diven by protein rather than mRNA abundance.
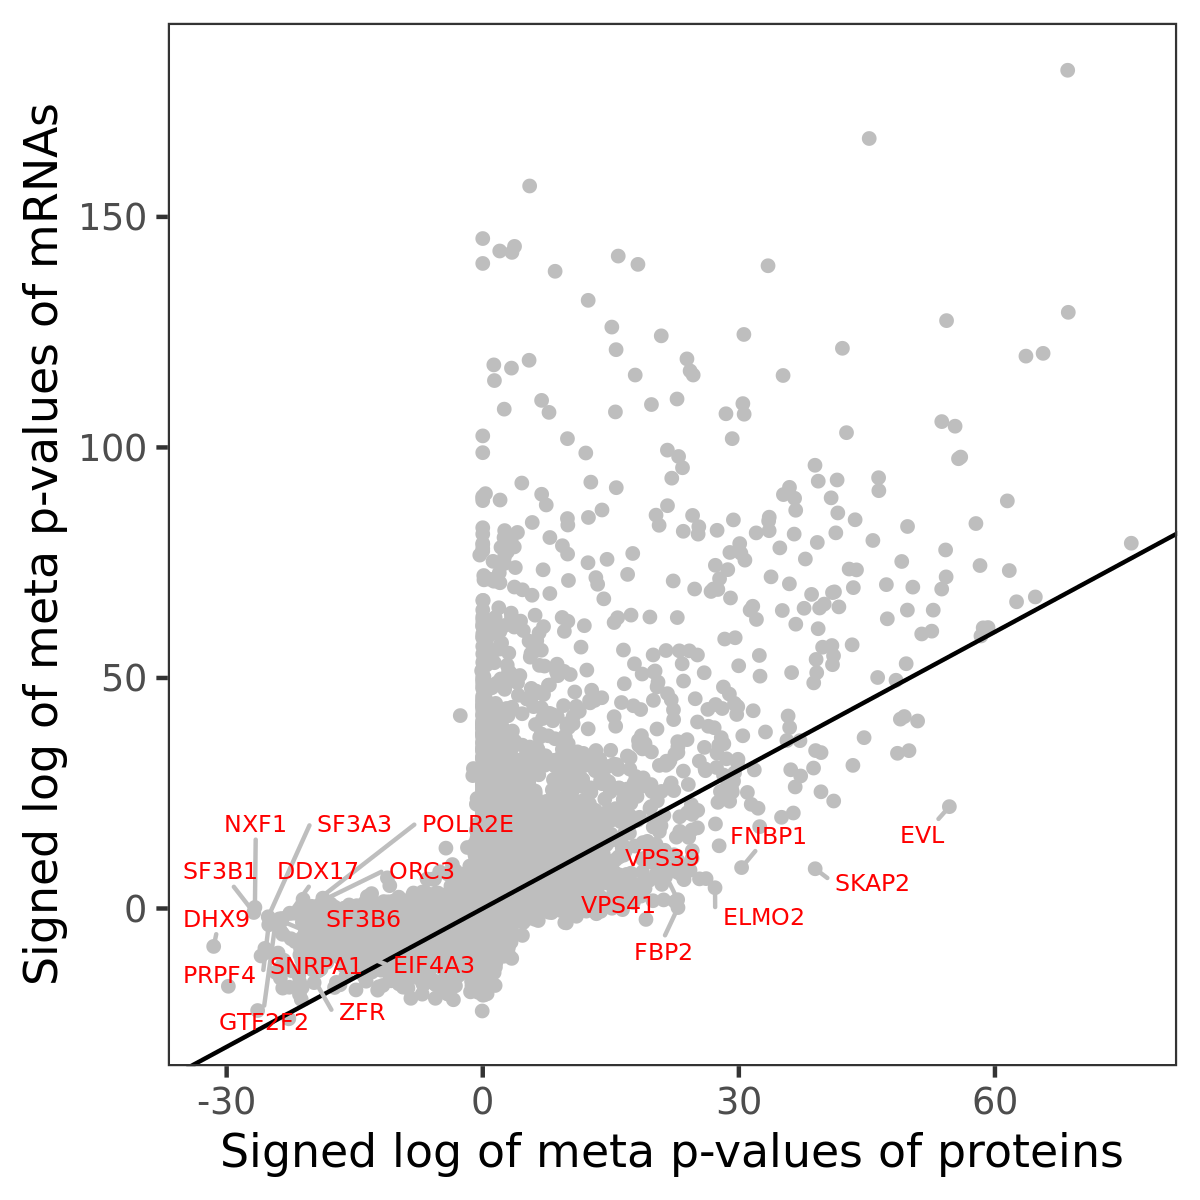
Association of protein abundance of genes
| Signed p-values | |||||||||||
|---|---|---|---|---|---|---|---|---|---|---|---|
| Gene | Meta P | BRCA | CCRCC | COAD | GBM | HNSCC | LSCC | LUAD | OV | PDAC | UCEC |
Gene set enrichment analysis
Submit genes and the common logarithm of the p-values of their association with xcell: Macrophage M2 to WebGestalt.
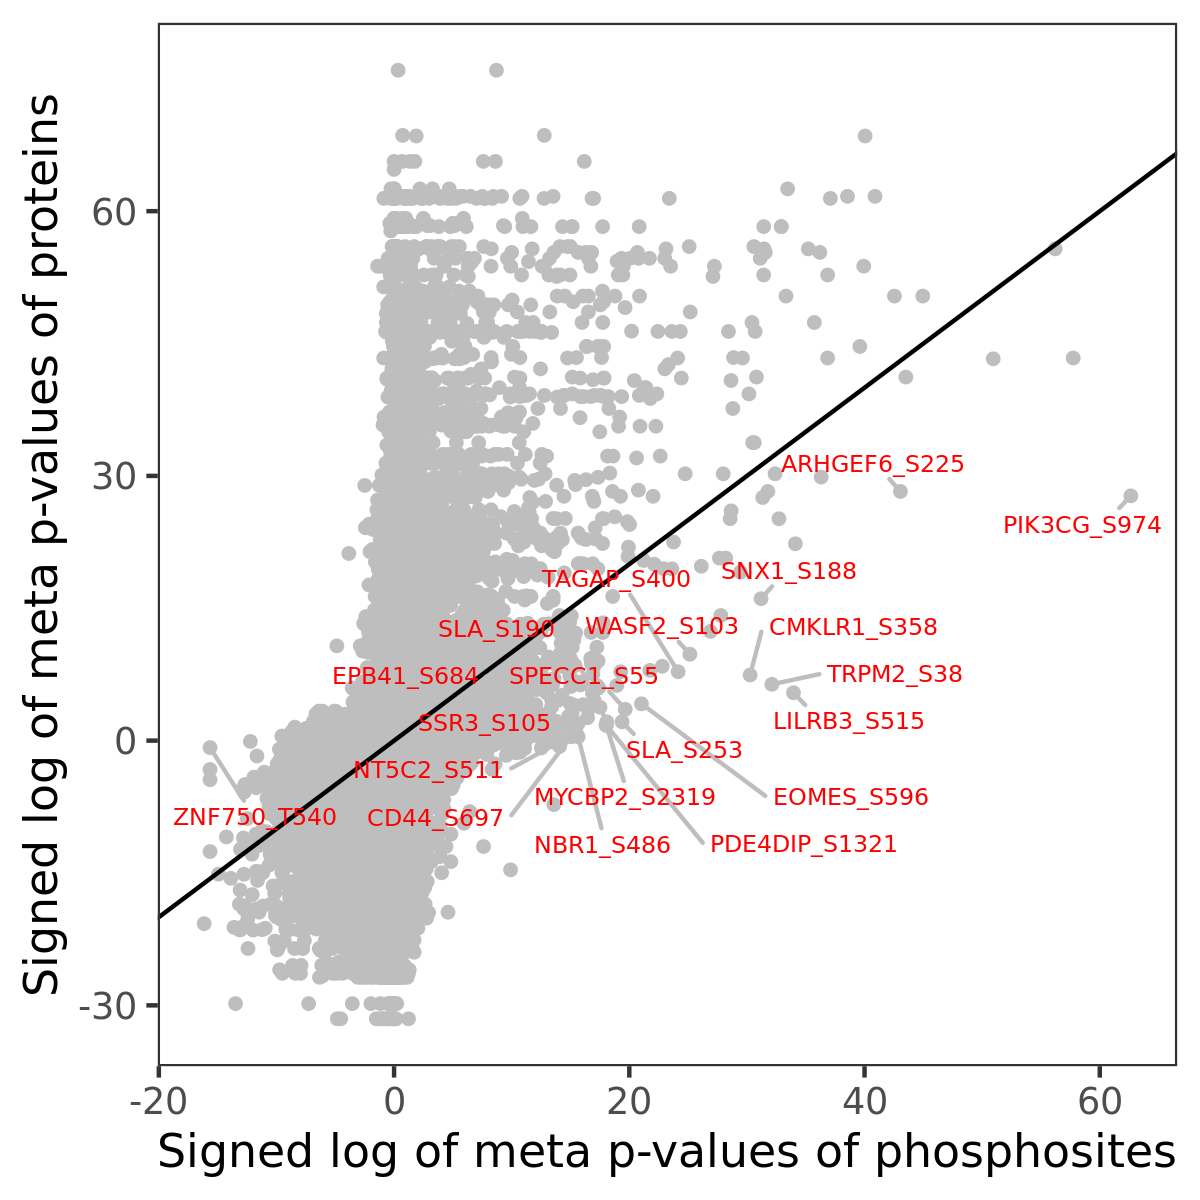
Phosphosite association
Number of significant genes with P-value ≤ 10-6 for each cohorts are summarized in the bar plot. The scatter plot highlights significant associations diven by phosphorylation rather than protein abundance.
| Signed p-values | |||||||||||||
|---|---|---|---|---|---|---|---|---|---|---|---|---|---|
| Gene | Protein | Site | Meta P | BRCA | CCRCC | COAD | GBM | HNSCC | LSCC | LUAD | OV | PDAC | UCEC |
Gene set enrichment analysis
Submit phosphorylation sites and the common logarithm of the p-values of their association with xcell: Macrophage M2 to WebGestalt.