Basic information
- Phenotype
- xcell: T cell CD8+
- Description
- Enrichment score inferring the proportion of CD8+ T cells in the tumor derived from RNA data using the xCell tool.
- Source
- https://genomebiology.biomedcentral.com/articles/10.1186/s13059-017-1349-1
- Method
- The R package immunedeconv (V2.0.4) (PMID: 31510660) was used to perform immune cell deconvolution using RNA expression data (TPM).
- Genes
-
- APBB1
- ARHGEF1
- BTN2A1
- C7orf26
- CA6
- CASP8
- CBY1
- CCDC25
- CCR7
- CD160
- CD27
- CD3D
- CD7
- CD8A
- CD8B
- CD96
- CEPT1
- CIAPIN1
- CLUAP1
- COG2
- COPZ1
- CRTAM
- CTSW
- CX3CR1
- DHX15
- DIDO1
- DNAJB1
- DPP8
- DSC1
- EEF1D
- EML3
- FBXW4
- FKTN
- FNBP4
- FTO
- GGNBP2
- GIMAP4
- GJC2
- GZMH
- GZMK
- GZMM
- HNRNPA0
- HNRNPL
- IL16
- IPCEF1
- IRF3
- KLHL3
- KLRB1
- KLRG1
- KRT2
- LAIR2
- LSM14A
- LY9
- MED17
- MKRN2
- MMP19
- MSL3
- MTRF1
- MYOM1
- NAA16
- NDFIP1
- NDUFS2
- NFKB1
- NKRF
- NPAT
- NPRL2
- PCNT
- PFN2
- PLCG1
- PLXDC1
- POLR3E
- POP5
- PRL
- PRMT2
- PRPF4B
- PSD
- PTGDR
- PTPN4
- PURA
- RAPGEF6
- RASA2
- RBL2
- RBM34
- RING1
- RNF113A
- RPL37A
- RWDD3
- S100B
- SDAD1
- SFPQ
- SHANK1
- SIRPG
- SLC1A7
- SSTR3
- TBCC
- TMEM41B
- TOMM7
- TRAF3IP3
- TSPAN32
- TTN
- UBE2Q1
- UBQLN2
- USP47
- UTP20
- WDR82
- YLPM1
- ZBTB11
- ZC3HAV1
- ZNF154
- ZNF200
- ZNF611
- ZNF639
- More...
Gene association
Number of significant genes with P-value ≤ 10-6 for each cohorts are summarized in bar plots. The scatter plot highlights significant associations diven by protein rather than mRNA abundance.
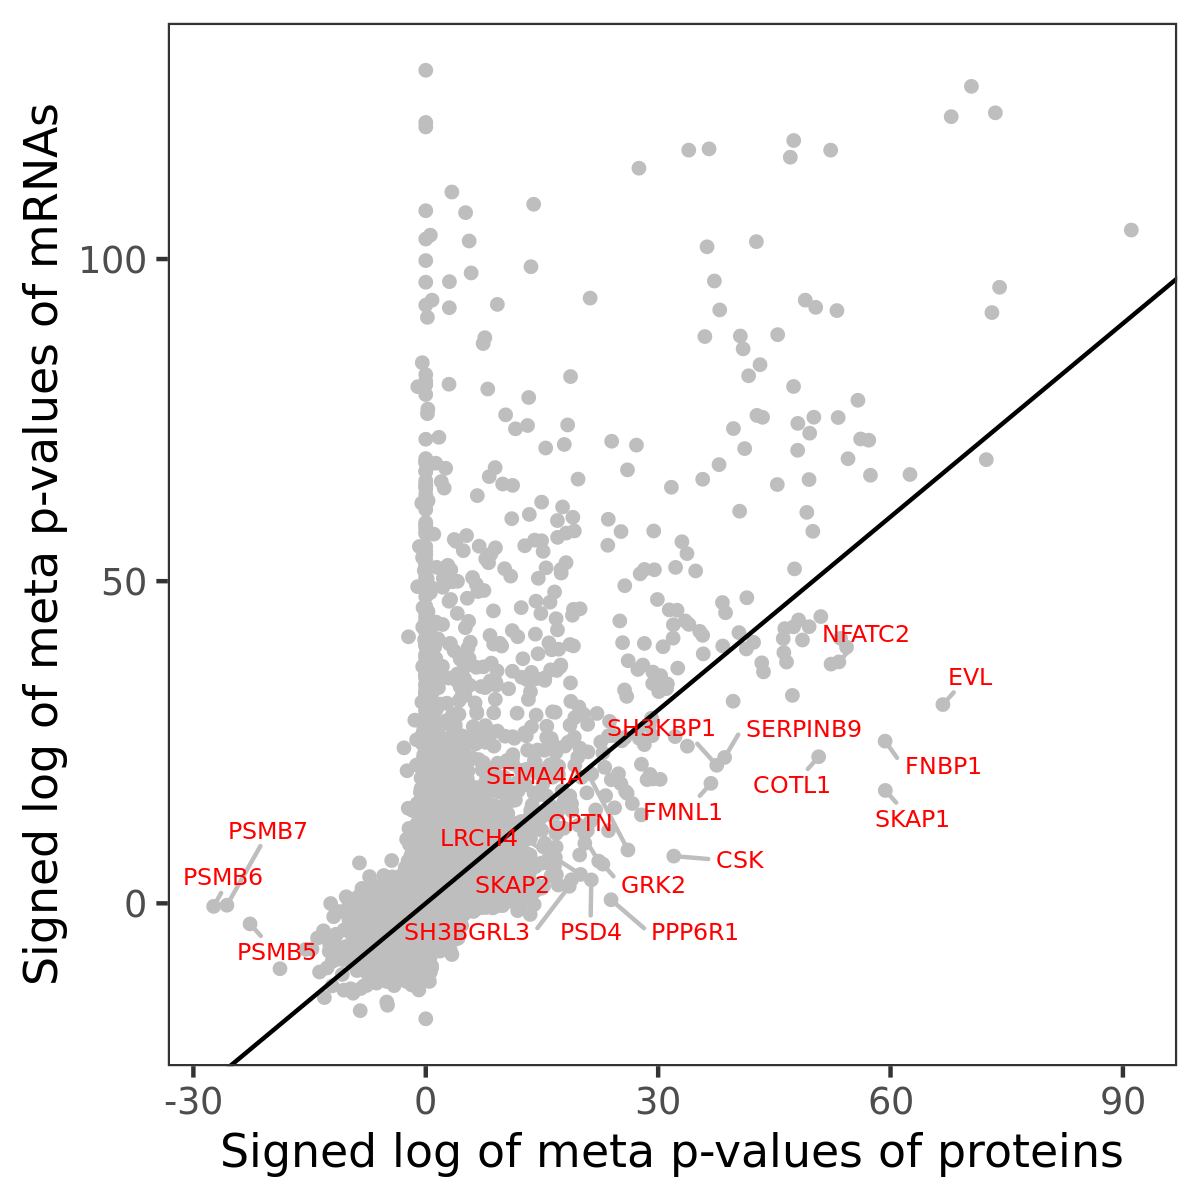
Association of protein abundance of genes
| Signed p-values | |||||||||||
|---|---|---|---|---|---|---|---|---|---|---|---|
| Gene | Meta P | BRCA | CCRCC | COAD | GBM | HNSCC | LSCC | LUAD | OV | PDAC | UCEC |
Gene set enrichment analysis
Submit genes and the common logarithm of the p-values of their association with xcell: T cell CD8+ to WebGestalt.
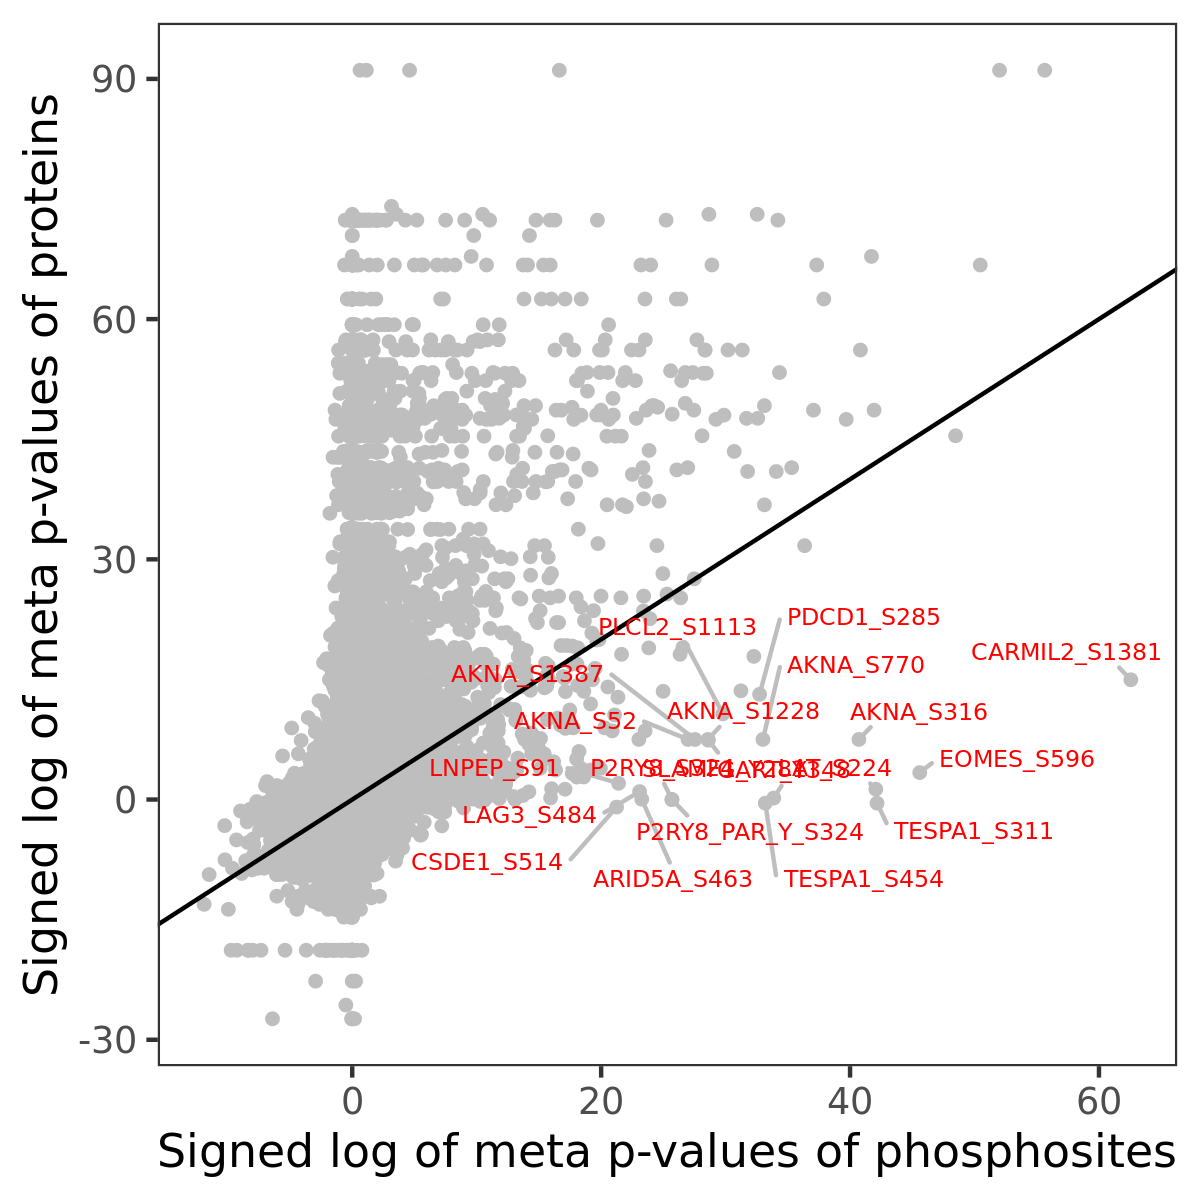
Phosphosite association
Number of significant genes with P-value ≤ 10-6 for each cohorts are summarized in the bar plot. The scatter plot highlights significant associations diven by phosphorylation rather than protein abundance.
| Signed p-values | |||||||||||||
|---|---|---|---|---|---|---|---|---|---|---|---|---|---|
| Gene | Protein | Site | Meta P | BRCA | CCRCC | COAD | GBM | HNSCC | LSCC | LUAD | OV | PDAC | UCEC |
Gene set enrichment analysis
Submit phosphorylation sites and the common logarithm of the p-values of their association with xcell: T cell CD8+ to WebGestalt.