Basic information
- Phenotype
- HALLMARK_APICAL_JUNCTION
- Description
- Enrichment score representing the components of the apical junction complex. The score was calculated using ssGSEA on the RNA data (Z-score transformed coding genes with expression in at least 50% of the samples in a cohort).
- Source
- http://www.gsea-msigdb.org/gsea/msigdb/cards/HALLMARK_APICAL_JUNCTION.html
- Method
- Single sample gene set enrichment analysis (ssGSEA) was performed for each cancer type using gene-wise Z-scores of the RNA expression data (RSEM) for the MSigDB Hallmark gene sets v7.0 (PMID: 26771021) via the ssGSEA2.0 R package (PMID: 30563849). RNA data were filtered to coding genes with < 50% 0 expression. (Parameters: sample.norm.type="rank", weight=0.75, statistic="area.under.RES", nperm=1000, min.overlap=10). Pathway activity scores are normalized enrichment scores from ssGSEA.
- Genes
-
- ACTB
- ACTC1
- ACTG1
- ACTG2
- ACTN1
- ACTN2
- ACTN3
- ACTN4
- ADAM15
- ADAM23
- ADAM9
- ADAMTS5
- ADRA1B
- AKT2
- AKT3
- ALOX15B
- AMH
- AMIGO1
- AMIGO2
- ARHGEF6
- ARPC2
- ATP1A3
- B4GALT1
- BAIAP2
- BMP1
- CADM2
- CADM3
- CALB2
- CAP1
- CD209
- CD274
- CD276
- CD34
- CD86
- CD99_PAR_Y
- CDH1
- CDH11
- CDH15
- CDH3
- CDH4
- CDH6
- CDH8
- CDK8
- CDSN
- CERCAM
- CLDN11
- CLDN14
- CLDN15
- CLDN18
- CLDN19
- CLDN4
- CLDN5
- CLDN6
- CLDN7
- CLDN8
- CLDN9
- CNN2
- CNTN1
- COL16A1
- COL17A1
- COL9A1
- CRAT
- CRB3
- CTNNA1
- CTNND1
- CX3CL1
- DHX16
- DLG1
- DMP1
- DSC1
- DSC3
- EGFR
- EPB41L2
- EVL
- EXOC4
- FBN1
- FLNC
- FSCN1
- FYB1
- GAMT
- GNAI1
- GNAI2
- GRB7
- GTF2F1
- HADH
- HRAS
- ICAM1
- ICAM2
- ICAM4
- ICAM5
- IKBKG
- INPPL1
- INSIG1
- IRS1
- ITGA10
- ITGA2
- ITGA3
- ITGA9
- ITGB1
- ITGB4
- JAM3
- JUP
- KCNH2
- KRT31
- LAMA3
- LAMB3
- LAMC2
- LAYN
- LDLRAP1
- LIMA1
- MADCAM1
- MAP3K20
- MAP4K2
- MAPK11
- MAPK13
- MAPK14
- MDK
- MMP2
- MMP9
- MPP5
- MPZL1
- MPZL2
- MSN
- MVD
- MYH10
- MYH9
- MYL12B
- MYL9
- NECTIN1
- NECTIN2
- NECTIN3
- NECTIN4
- NEGR1
- NEXN
- NF1
- NF2
- NFASC
- NLGN2
- NLGN3
- NRAP
- NRTN
- NRXN2
- PARD6G
- PARVA
- PBX2
- PCDH1
- PDZD3
- PECAM1
- PFN1
- PIK3CB
- PIK3R3
- PKD1
- PLCG1
- PPP2R2C
- PTEN
- PTK2
- PTPRC
- RAC2
- RASA1
- RHOF
- RRAS
- RSU1
- SDC3
- SGCE
- SHC1
- SHROOM2
- SIRPA
- SKAP2
- SLC30A3
- SLIT2
- SORBS3
- SPEG
- SRC
- STX4
- SYK
- SYMPK
- TAOK2
- TGFBI
- THBS3
- THY1
- TIAL1
- TJP1
- TMEM8B
- TNFRSF11B
- TRAF1
- TRO
- TSC1
- TSPAN4
- TUBG1
- VASP
- VAV2
- VCAM1
- VCAN
- VCL
- VWF
- WASL
- WNK4
- YWHAH
- ZYX
- More...
Gene association
Number of significant genes with P-value ≤ 10-6 for each cohorts are summarized in bar plots. The scatter plot highlights significant associations diven by protein rather than mRNA abundance.
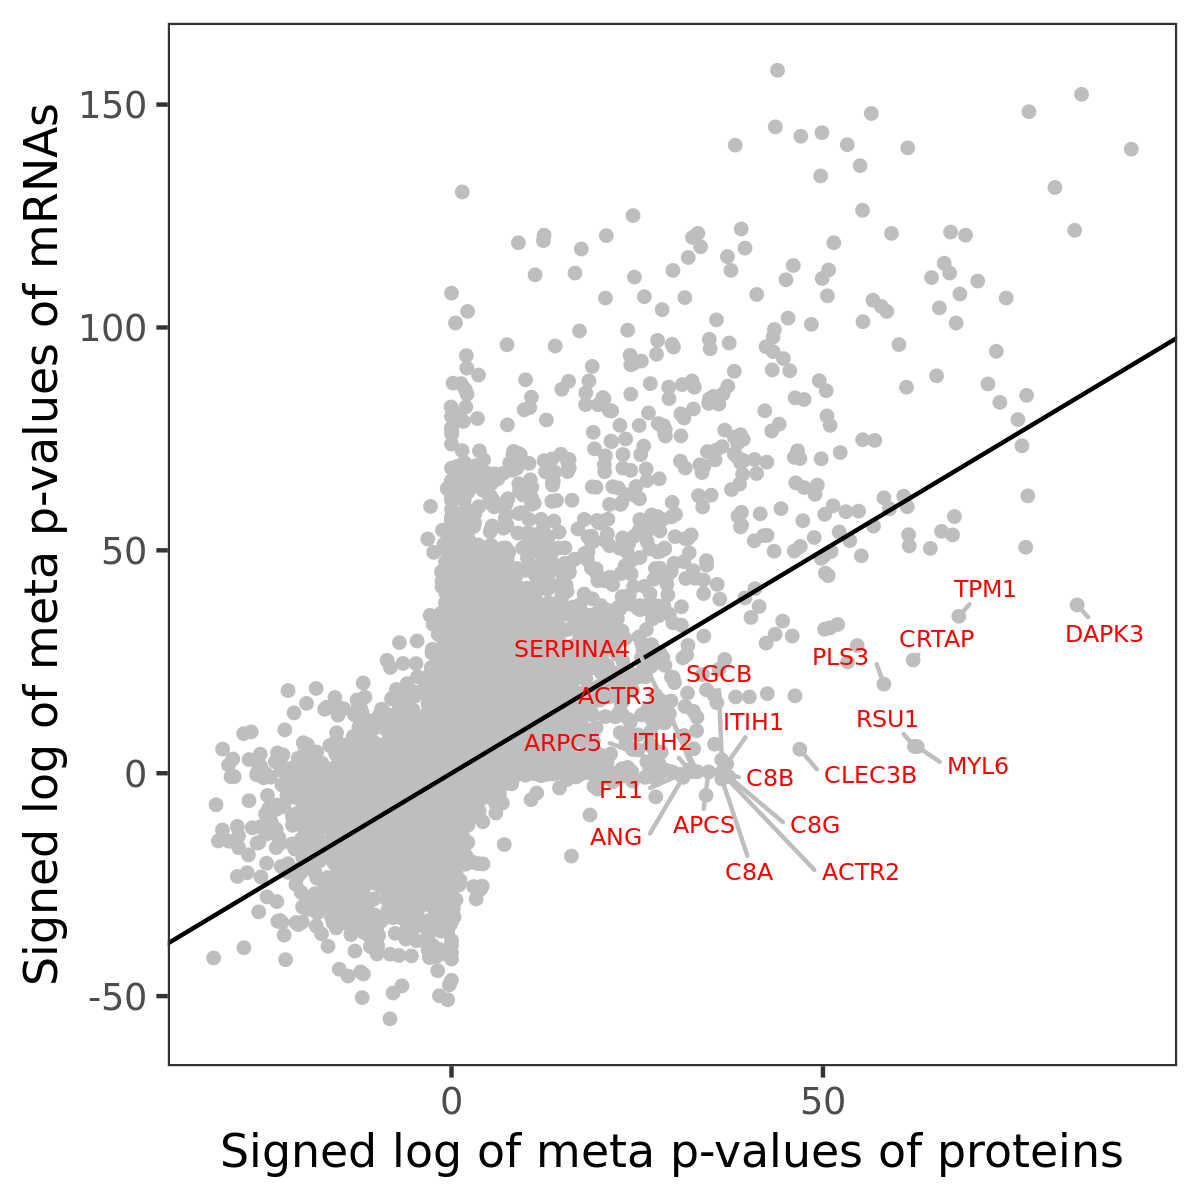
Association of protein abundance of genes
| Signed p-values | |||||||||||
|---|---|---|---|---|---|---|---|---|---|---|---|
| Gene | Meta P | BRCA | CCRCC | COAD | GBM | HNSCC | LSCC | LUAD | OV | PDAC | UCEC |
Gene set enrichment analysis
Submit genes and the common logarithm of the p-values of their association with HALLMARK_APICAL_JUNCTION to WebGestalt.
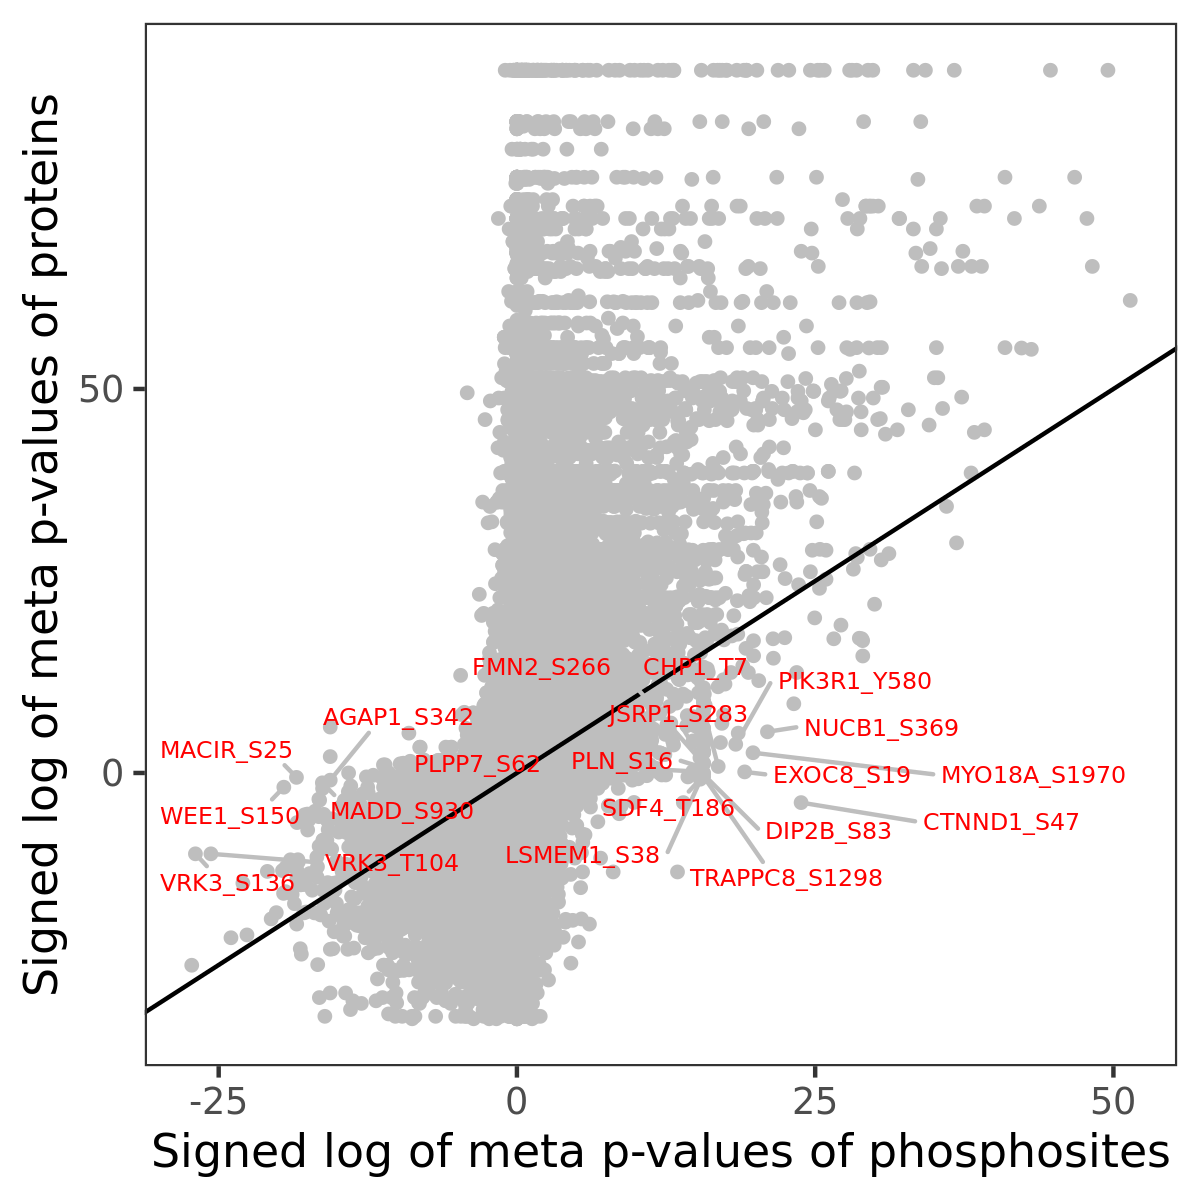
Phosphosite association
Number of significant genes with P-value ≤ 10-6 for each cohorts are summarized in the bar plot. The scatter plot highlights significant associations diven by phosphorylation rather than protein abundance.
| Signed p-values | |||||||||||||
|---|---|---|---|---|---|---|---|---|---|---|---|---|---|
| Gene | Protein | Site | Meta P | BRCA | CCRCC | COAD | GBM | HNSCC | LSCC | LUAD | OV | PDAC | UCEC |
Gene set enrichment analysis
Submit phosphorylation sites and the common logarithm of the p-values of their association with HALLMARK_APICAL_JUNCTION to WebGestalt.