Basic information
- Phenotype
- HALLMARK_COAGULATION
- Description
- Enrichment score representing the components of the blood coagulation system. The score was calculated using ssGSEA on the RNA data (Z-score transformed coding genes with expression in at least 50% of the samples in a cohort).
- Source
- http://www.gsea-msigdb.org/gsea/msigdb/cards/HALLMARK_COAGULATION.html
- Method
- Single sample gene set enrichment analysis (ssGSEA) was performed for each cancer type using gene-wise Z-scores of the RNA expression data (RSEM) for the MSigDB Hallmark gene sets v7.0 (PMID: 26771021) via the ssGSEA2.0 R package (PMID: 30563849). RNA data were filtered to coding genes with < 50% 0 expression. (Parameters: sample.norm.type="rank", weight=0.75, statistic="area.under.RES", nperm=1000, min.overlap=10). Pathway activity scores are normalized enrichment scores from ssGSEA.
- Genes
-
- ACOX2
- ADAM9
- ANG
- ANXA1
- APOA1
- APOC1
- APOC2
- APOC3
- ARF4
- BMP1
- C1QA
- C1R
- C1S
- C2
- C3
- C8A
- C8B
- C8G
- C9
- CAPN2
- CAPN5
- CASP9
- CD9
- CFB
- CFD
- CFH
- CFI
- CLU
- COMP
- CPB2
- CPN1
- CPQ
- CRIP2
- CSRP1
- CTSB
- CTSE
- CTSH
- CTSK
- CTSO
- CTSV
- DCT
- DPP4
- DUSP14
- DUSP6
- F10
- F11
- F12
- F13B
- F2
- F2RL2
- F3
- F8
- F9
- FBN1
- FGA
- FGG
- FN1
- FURIN
- FYN
- GDA
- GNB2
- GNG12
- GP1BA
- GP9
- GSN
- HMGCS2
- HNF4A
- HPN
- HRG
- HTRA1
- ISCU
- ITGA2
- ITGB3
- ITIH1
- KLF7
- KLK8
- KLKB1
- LAMP2
- LEFTY2
- LGMN
- LRP1
- LTA4H
- MAFF
- MASP2
- MBL2
- MEP1A
- MMP1
- MMP10
- MMP11
- MMP14
- MMP15
- MMP2
- MMP3
- MMP7
- MMP8
- MMP9
- MSRB2
- MST1
- OLR1
- P2RY1
- PDGFB
- PECAM1
- PEF1
- PF4
- PLAT
- PLAU
- PLEK
- PLG
- PREP
- PROC
- PROS1
- PROZ
- PRSS23
- RABIF
- RAC1
- RAPGEF3
- RGN
- S100A1
- S100A13
- SERPINA1
- SERPINB2
- SERPINC1
- SERPINE1
- SERPING1
- SH2B2
- SIRT2
- SPARC
- TF
- TFPI2
- THBD
- THBS1
- TIMP1
- TIMP3
- TMPRSS6
- USP11
- VWF
- WDR1
- More...
Gene association
Number of significant genes with P-value ≤ 10-6 for each cohorts are summarized in bar plots. The scatter plot highlights significant associations diven by protein rather than mRNA abundance.
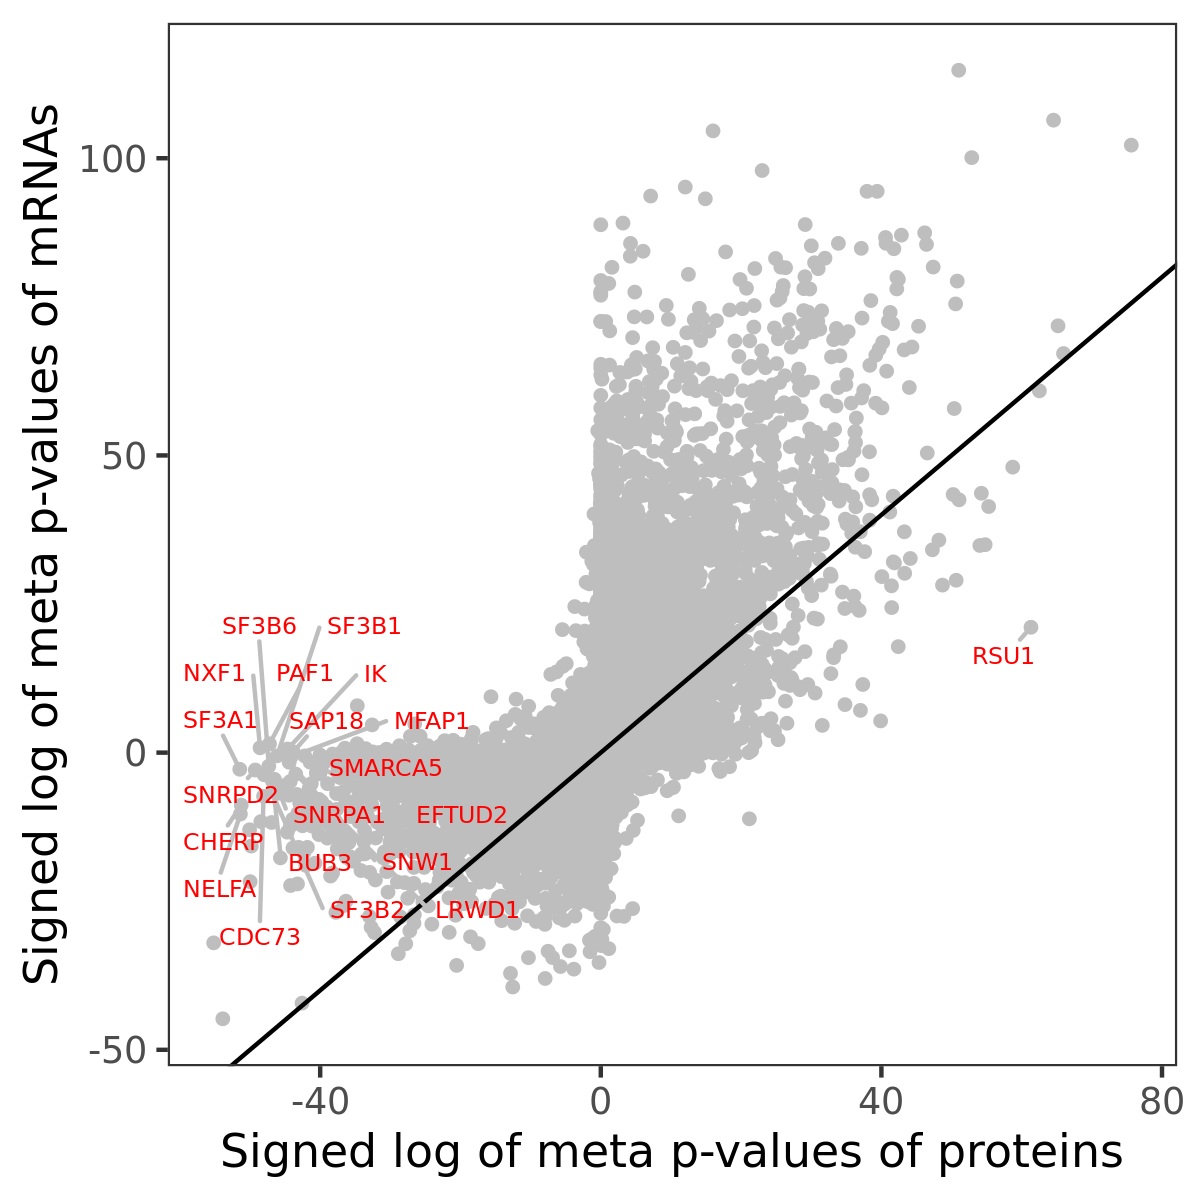
Association of protein abundance of genes
Signed p-values | ||||||||||||
|---|---|---|---|---|---|---|---|---|---|---|---|---|
Gene | Meta P | BRCA | CCRCC | COAD | GBM | HNSCC | LSCC | LUAD | OV | PDAC | UCEC | |
| No matching records found | ||||||||||||
Gene set enrichment analysis
Submit genes and the common logarithm of the p-values of their association with HALLMARK_COAGULATION to WebGestalt.
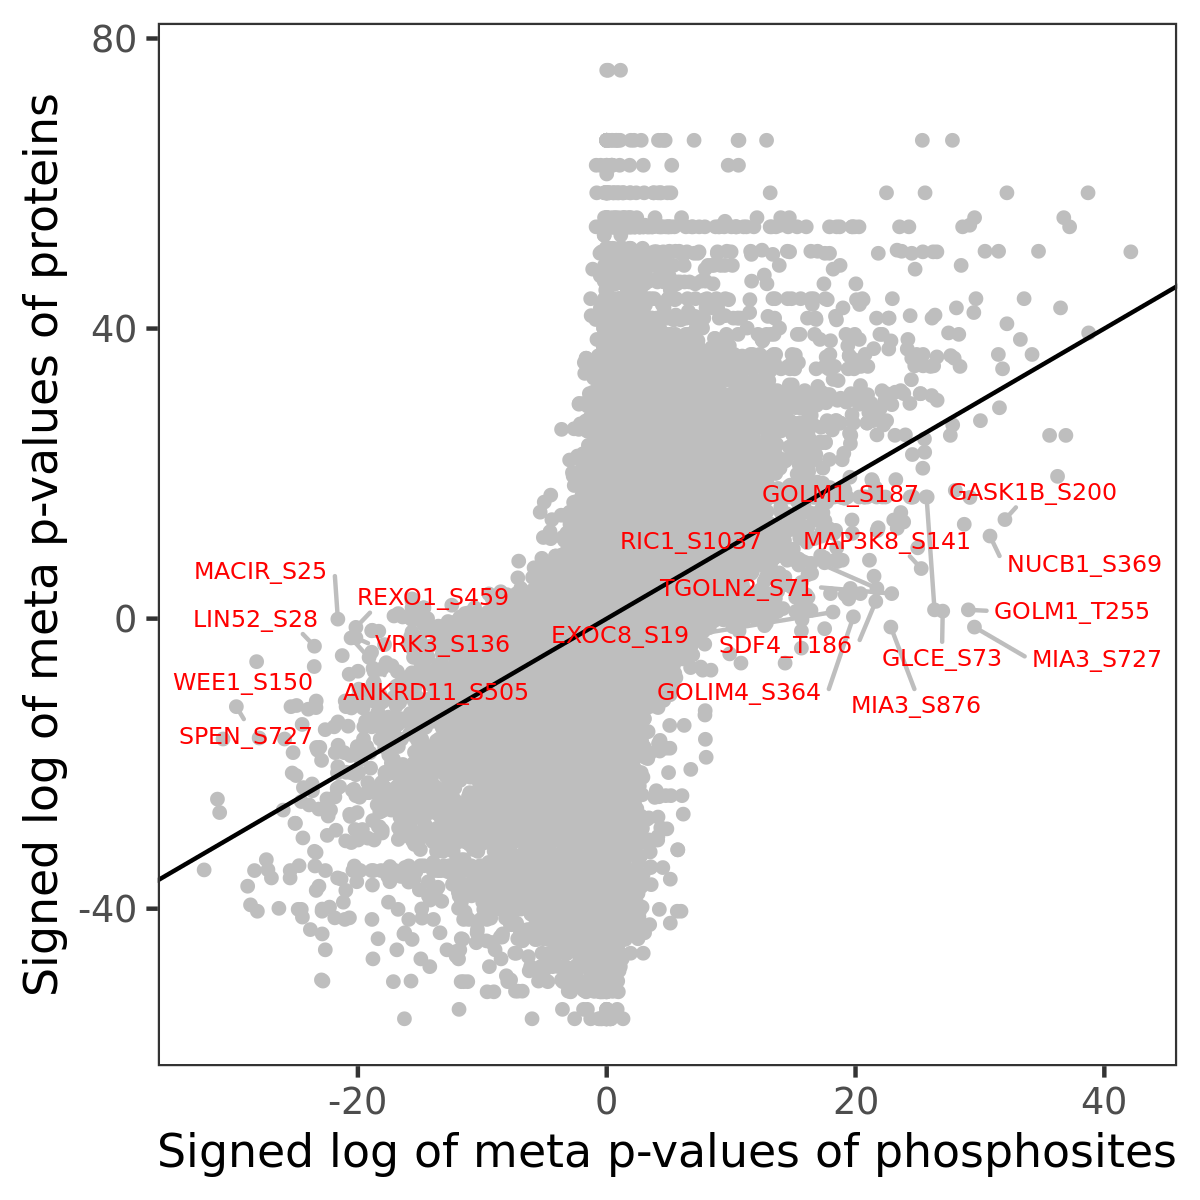
Phosphosite association
Number of significant genes with P-value ≤ 10-6 for each cohorts are summarized in the bar plot. The scatter plot highlights significant associations diven by phosphorylation rather than protein abundance.
Signed p-values | |||||||||||||
|---|---|---|---|---|---|---|---|---|---|---|---|---|---|
Gene | Protein | Site | Meta P | BRCA | CCRCC | COAD | GBM | HNSCC | LSCC | LUAD | OV | PDAC | UCEC |
| No matching records found | |||||||||||||
Gene set enrichment analysis
Submit phosphorylation sites and the common logarithm of the p-values of their association with HALLMARK_COAGULATION to WebGestalt.