Basic information
- Phenotype
- HALLMARK_MTORC1_SIGNALING
- Description
- Enrichment score representing MTORC1 signaling. The score was calculated using ssGSEA on the RNA data (Z-score transformed coding genes with expression in at least 50% of the samples in a cohort).
- Source
- http://www.gsea-msigdb.org/gsea/msigdb/cards/HALLMARK_MTORC1_SIGNALING.html
- Method
- Single sample gene set enrichment analysis (ssGSEA) was performed for each cancer type using gene-wise Z-scores of the RNA expression data (RSEM) for the MSigDB Hallmark gene sets v7.0 (PMID: 26771021) via the ssGSEA2.0 R package (PMID: 30563849). RNA data were filtered to coding genes with < 50% 0 expression. (Parameters: sample.norm.type="rank", weight=0.75, statistic="area.under.RES", nperm=1000, min.overlap=10). Pathway activity scores are normalized enrichment scores from ssGSEA.
- Genes
-
- ACACA
- ACLY
- ACSL3
- ACTR2
- ACTR3
- ADD3
- ADIPOR2
- AK4
- ALDOA
- ARPC5L
- ASNS
- ATP2A2
- ATP5MC1
- ATP6V1D
- AURKA
- BCAT1
- BHLHE40
- BTG2
- BUB1
- CACYBP
- CALR
- CANX
- CCNF
- CCNG1
- CCT6A
- CD9
- CDC25A
- CDKN1A
- CFP
- COPS5
- CORO1A
- CTH
- CTSC
- CXCR4
- CYB5B
- CYP51A1
- DAPP1
- DDIT3
- DDIT4
- DDX39A
- DHCR24
- DHCR7
- DHFR
- EBP
- EDEM1
- EEF1E1
- EGLN3
- EIF2S2
- ELOVL5
- ELOVL6
- ENO1
- EPRS1
- ERO1A
- ETF1
- FADS1
- FADS2
- FDXR
- FGL2
- FKBP2
- G6PD
- GAPDH
- GBE1
- GCLC
- GGA2
- GLA
- GLRX
- GMPS
- GOT1
- GPI
- GSK3B
- GSR
- GTF2H1
- HK2
- HMBS
- HMGCR
- HMGCS1
- HPRT1
- HSP90B1
- HSPA4
- HSPA5
- HSPA9
- HSPD1
- HSPE1
- IDH1
- IDI1
- IFI30
- IFRD1
- IGFBP5
- IMMT
- INSIG1
- ITGB2
- LDHA
- LDLR
- LGMN
- LTA4H
- M6PR
- MAP2K3
- MCM2
- MCM4
- ME1
- MLLT11
- MTHFD2
- MTHFD2L
- NAMPT
- NFIL3
- NFKBIB
- NFYC
- NIBAN1
- NMT1
- NUFIP1
- NUP205
- NUPR1
- P4HA1
- PDAP1
- PDK1
- PFKL
- PGK1
- PGM1
- PHGDH
- PIK3R3
- PITPNB
- PLK1
- PLOD2
- PNO1
- PNP
- POLR3G
- PPA1
- PPIA
- PPP1R15A
- PRDX1
- PSAT1
- PSMA3
- PSMA4
- PSMB5
- PSMC2
- PSMC4
- PSMC6
- PSMD12
- PSMD13
- PSMD14
- PSME3
- PSMG1
- PSPH
- QDPR
- RAB1A
- RDH11
- RIT1
- RPA1
- RPN1
- RRM2
- RRP9
- SC5D
- SCD
- SDF2L1
- SEC11A
- SERP1
- SERPINH1
- SHMT2
- SKAP2
- SLA
- SLC1A4
- SLC1A5
- SLC2A1
- SLC2A3
- SLC37A4
- SLC6A6
- SLC7A11
- SLC7A5
- SLC9A3R1
- SORD
- SQLE
- SQSTM1
- SRD5A1
- SSR1
- STARD4
- STC1
- STIP1
- SYTL2
- TBK1
- TCEA1
- TES
- TFRC
- TM7SF2
- TMEM97
- TOMM40
- TPI1
- TRIB3
- TUBA4A
- TUBG1
- TXNRD1
- UBE2D3
- UCHL5
- UFM1
- UNG
- USO1
- VLDLR
- WARS1
- XBP1
- YKT6
- More...
Gene association
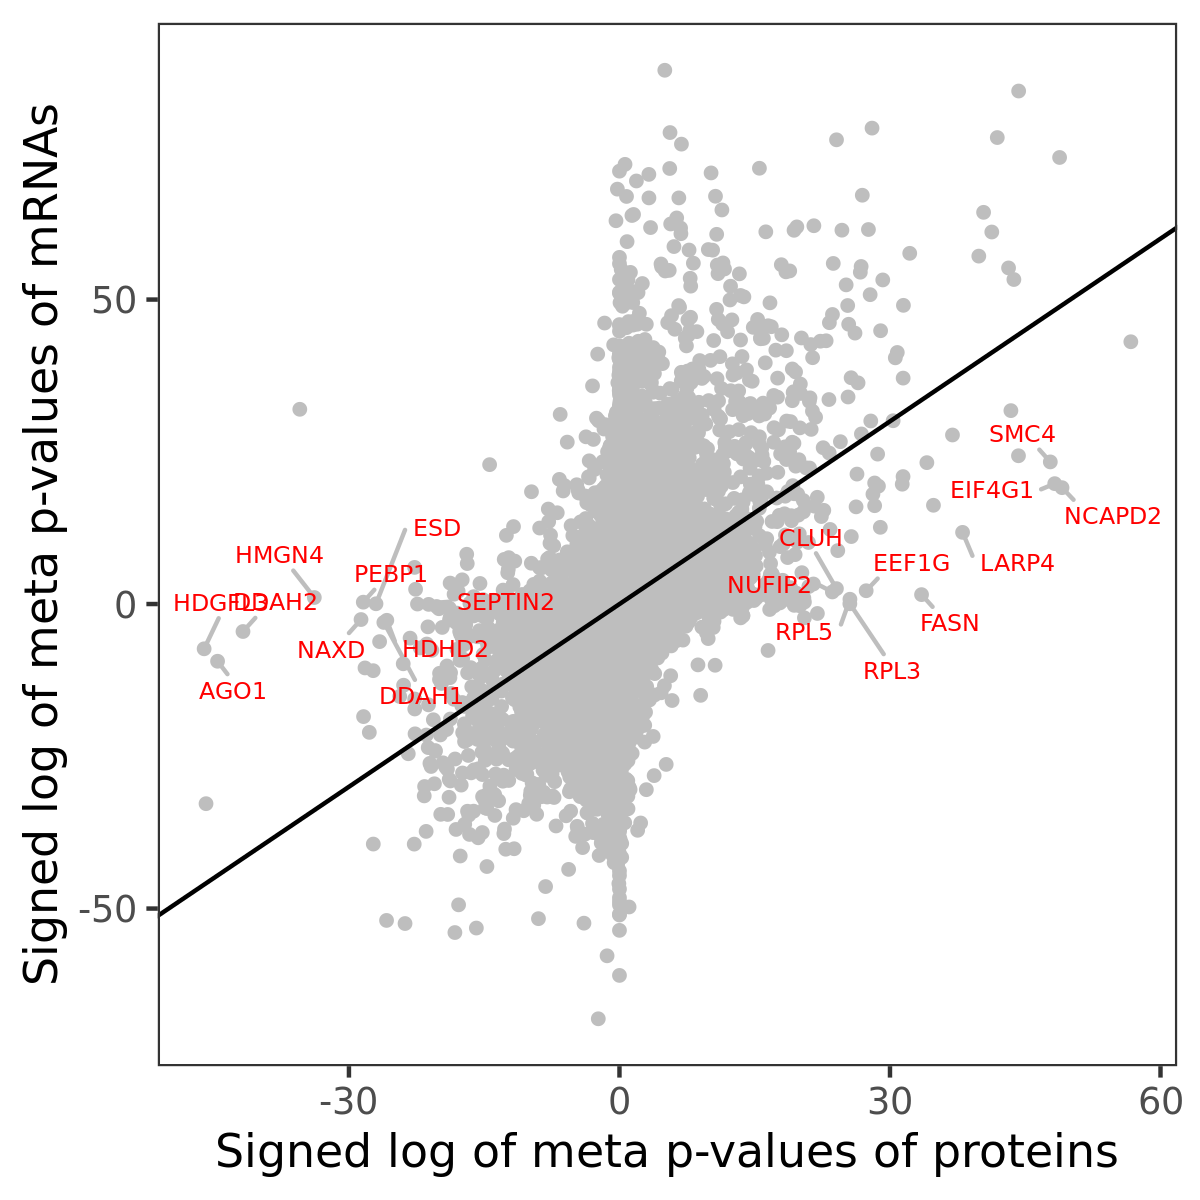
Number of significant genes with P-value ≤ 10-6 for each cohorts are summarized in bar plots. The scatter plot highlights significant associations diven by protein rather than mRNA abundance.

Association of protein abundance of genes
Signed p-values | ||||||||||||
|---|---|---|---|---|---|---|---|---|---|---|---|---|
Gene | Meta P | BRCA | CCRCC | COAD | GBM | HNSCC | LSCC | LUAD | OV | PDAC | UCEC | |
| No matching records found | ||||||||||||
Gene set enrichment analysis
Submit genes and the common logarithm of the p-values of their association with HALLMARK_MTORC1_SIGNALING to WebGestalt.
Phosphosite association
Number of significant genes with P-value ≤ 10-6 for each cohorts are summarized in the bar plot. The scatter plot highlights significant associations diven by phosphorylation rather than protein abundance.

Signed p-values | |||||||||||||
|---|---|---|---|---|---|---|---|---|---|---|---|---|---|
Gene | Protein | Site | Meta P | BRCA | CCRCC | COAD | GBM | HNSCC | LSCC | LUAD | OV | PDAC | UCEC |
| No matching records found | |||||||||||||
Gene set enrichment analysis
Submit phosphorylation sites and the common logarithm of the p-values of their association with HALLMARK_MTORC1_SIGNALING to WebGestalt.