Basic information
- Phenotype
- HALLMARK_PEROXISOME
- Description
- Enrichment score representing the components of the peroxisome. The score was calculated using ssGSEA on the RNA data (Z-score transformed coding genes with expression in at least 50% of the samples in a cohort).
- Source
- http://www.gsea-msigdb.org/gsea/msigdb/cards/HALLMARK_PEROXISOME.html
- Method
- Single sample gene set enrichment analysis (ssGSEA) was performed for each cancer type using gene-wise Z-scores of the RNA expression data (RSEM) for the MSigDB Hallmark gene sets v7.0 (PMID: 26771021) via the ssGSEA2.0 R package (PMID: 30563849). RNA data were filtered to coding genes with < 50% 0 expression. (Parameters: sample.norm.type="rank", weight=0.75, statistic="area.under.RES", nperm=1000, min.overlap=10). Pathway activity scores are normalized enrichment scores from ssGSEA.
- Genes
-
- ABCB4
- ABCB9
- ABCC5
- ABCC8
- ABCD1
- ABCD2
- ABCD3
- ACAA1
- ACOT8
- ACOX1
- ACSL1
- ACSL4
- ACSL5
- ALB
- ALDH1A1
- ALDH9A1
- ATXN1
- BCL10
- CACNA1B
- CADM1
- CAT
- CDK7
- CEL
- CLN6
- CLN8
- CNBP
- CRABP1
- CRABP2
- CRAT
- CTBP1
- CTPS1
- DHCR24
- DHRS3
- DIO1
- DLG4
- ECH1
- ECI2
- EHHADH
- ELOVL5
- EPHX2
- ERCC1
- ERCC3
- ESR2
- FABP6
- FADS1
- FDPS
- FIS1
- GNPAT
- GSTK1
- HAO2
- HMGCL
- HRAS
- HSD11B2
- HSD17B11
- HSD17B4
- HSD3B7
- IDE
- IDH1
- IDH2
- IDI1
- ISOC1
- ITGB1BP1
- LONP2
- MLYCD
- MSH2
- MVP
- NR1I2
- NUDT19
- PABPC1
- PEX11A
- PEX11B
- PEX13
- PEX14
- PEX2
- PEX5
- PEX6
- PRDX1
- PRDX5
- RDH11
- RETSAT
- RXRG
- SCGB1A1
- SCP2
- SEMA3C
- SERPINA6
- SIAH1
- SLC23A2
- SLC25A17
- SLC25A19
- SLC25A4
- SLC27A2
- SLC35B2
- SMARCC1
- SOD1
- SOD2_ENSG00000285441
- STS
- SULT2B1
- TOP2A
- TSPO
- TTR
- UGT2B17
- VPS4B
- YWHAH
- More...
Gene association
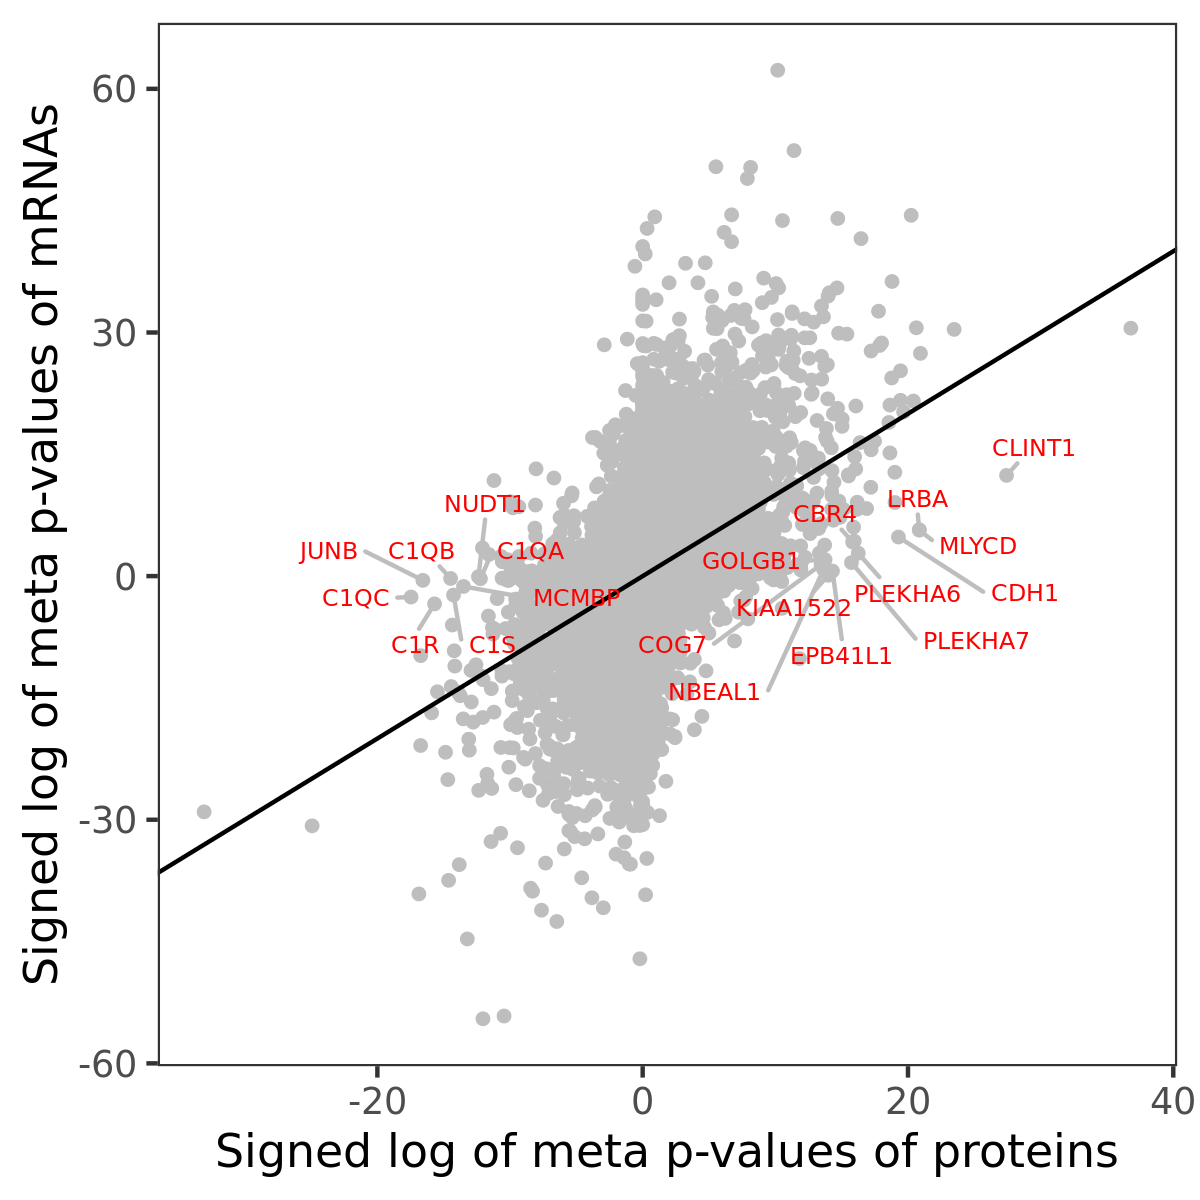
Number of significant genes with P-value ≤ 10-6 for each cohorts are summarized in bar plots. The scatter plot highlights significant associations diven by protein rather than mRNA abundance.

Association of protein abundance of genes
| Signed p-values | |||||||||||
|---|---|---|---|---|---|---|---|---|---|---|---|
| Gene | Meta P | BRCA | CCRCC | COAD | GBM | HNSCC | LSCC | LUAD | OV | PDAC | UCEC |
Gene set enrichment analysis
Submit genes and the common logarithm of the p-values of their association with HALLMARK_PEROXISOME to WebGestalt.
Phosphosite association
Number of significant genes with P-value ≤ 10-6 for each cohorts are summarized in the bar plot. The scatter plot highlights significant associations diven by phosphorylation rather than protein abundance.

| Signed p-values | |||||||||||||
|---|---|---|---|---|---|---|---|---|---|---|---|---|---|
| Gene | Protein | Site | Meta P | BRCA | CCRCC | COAD | GBM | HNSCC | LSCC | LUAD | OV | PDAC | UCEC |
Gene set enrichment analysis
Submit phosphorylation sites and the common logarithm of the p-values of their association with HALLMARK_PEROXISOME to WebGestalt.